Load selected astrocytes signalling data estimated using Liana-py and Rank Aggregation method (including CellPhoneDB, CellChat, ICELLNET, connectomeDB2020, and CellTalkDB) for CellChatDB only
# Reshape the dataframe back to a long formatdf_long <- df_wide %>%pivot_longer(cols =c(`Astro_INSR+==>POMC neurons`, `Astro_INSR-==>POMC neurons`), names_to ="pairs", values_to ="lr_probs") %>%full_join(df_specificity, by =c("pairs", "lr_complex", "ligand_complex", "receptor_complex", "control"))df_long
# Generate the plotpr <-ggplot(df_long, aes(x = pairs, y = lr_probs, color =as.factor(diff_category), size = neg_log10_specificity_rank)) +geom_jitter(width =0.05) +geom_line(aes(group = lr_complex), linetype ="solid", alpha =0.2) +theme_minimal() +theme(axis.text.x =element_text(angle =90, vjust =0.5, hjust =1)) +facet_wrap(~diff_category)# Add text labels for min and max 5 values within each group using ggrepelpr <- pr +geom_text_repel(data = top_bot_10 %>%filter( pairs =="Astro_INSR+==>POMC neurons", diff_rank >=0 ),aes(label = receptor_complex,point.size = neg_log10_specificity_rank ), # data point sizenudge_x =0.2, direction ="y", hjust ="left",size =6, # font size in the text labelspoint.padding =0.2, # additional padding around each pointmin.segment.length =0, # draw all line segmentsmax.time =5, max.iter =1e6, # stop after 1 second, or after 100,000 iterationsseed = reseed,max.overlaps =Inf,box.padding =0.5) +geom_text_repel(data = top_bot_10 %>%filter( pairs =="Astro_INSR-==>POMC neurons", diff_rank <=0 ),aes(label = receptor_complex,point.size = neg_log10_specificity_rank ), # data point sizenudge_x =-.2, direction ="y", hjust ="right",size =6, # font size in the text labelspoint.padding =0.2, # additional padding around each pointmin.segment.length =0, # draw all line segmentsmax.time =5, max.iter =1e6, # stop after 1 second, or after 100,000 iterationsseed = reseed,max.overlaps =Inf,box.padding =0.5) +scale_x_discrete(expand =expansion(add =2))print(pr)
Code
pl <-ggplot(df_long, aes(x = pairs, y = lr_probs, color =as.factor(diff_category), size = neg_log10_specificity_rank)) +geom_jitter(width =0.05) +geom_line(aes(group = lr_complex), linetype ="solid", alpha =0.2) +theme_minimal() +theme(axis.text.x =element_text(angle =90, vjust =0.5, hjust =1)) +facet_wrap(~diff_category)# Add text labels for min and max 5 values within each group using ggrepelpl <- pl +geom_text_repel(data = top_bot_10 %>%filter( pairs =="Astro_INSR+==>POMC neurons", diff_rank >=0 ),aes(label = ligand_complex,point.size = neg_log10_specificity_rank ), # data point sizenudge_x =0.2, direction ="y", hjust ="left",size =6, # font size in the text labelspoint.padding =0.2, # additional padding around each pointmin.segment.length =0, # draw all line segmentsmax.time =5, max.iter =1e6, # stop after 1 second, or after 100,000 iterationsseed = reseed,max.overlaps =Inf,box.padding =0.5) +geom_text_repel(data = top_bot_10 %>%filter( pairs =="Astro_INSR-==>POMC neurons", diff_rank <=0 ),aes(label = ligand_complex,point.size = neg_log10_specificity_rank ), # data point sizenudge_x =-.2, direction ="y", hjust ="right",size =6, # font size in the text labelspoint.padding =0.2, # additional padding around each pointmin.segment.length =0, # draw all line segmentsmax.time =5, max.iter =1e6, # stop after 1 second, or after 100,000 iterationsseed = reseed,max.overlaps =Inf,box.padding =0.5) +scale_x_discrete(expand =expansion(add =2))print(pl)
Code
plr <-ggplot(df_long, aes(x = pairs, y = lr_probs, color =as.factor(diff_category), size = neg_log10_specificity_rank)) +geom_jitter(width =0.05) +geom_line(aes(group = lr_complex), linetype ="solid", alpha =0.2) +theme_minimal() +theme(axis.text.x =element_text(angle =90, vjust =0.5, hjust =1)) +facet_wrap(~diff_category)# Add text labels for min and max 5 values within each group using ggrepelplr <- plr +geom_text_repel(data = top_bot_10 %>%filter( (pairs =="Astro_INSR+==>POMC neurons"& diff_rank >=0) | (!is.na(lr_probs) & pairs =="Astro_INSR+==>POMC neurons"&is.na(diff_rank)) ),aes(label = lr_complex,point.size = neg_log10_specificity_rank ), # data point sizenudge_x =0.2, direction ="y", hjust ="left",size =6, # font size in the text labelspoint.padding =0.2, # additional padding around each pointmin.segment.length =0, # draw all line segmentsmax.time =5, max.iter =1e6, # stop after 1 second, or after 100,000 iterationsseed = reseed,max.overlaps =Inf,box.padding =0.5) +geom_text_repel(data = top_bot_10 %>%filter( (pairs =="Astro_INSR-==>POMC neurons"& diff_rank <=0) | (!is.na(lr_probs) & pairs =="Astro_INSR-==>POMC neurons"&is.na(diff_rank)) ),aes(label = lr_complex,point.size = neg_log10_specificity_rank ), # data point sizenudge_x =-.2, direction ="y", hjust ="right",size =6, # font size in the text labelspoint.padding =0.2, # additional padding around each pointmin.segment.length =0, # draw all line segmentsmax.time =5, max.iter =1e6, # stop after 1 second, or after 100,000 iterationsseed = reseed,max.overlaps =Inf,box.padding =0.5) +scale_x_discrete(expand =expansion(add =2))print(plr)
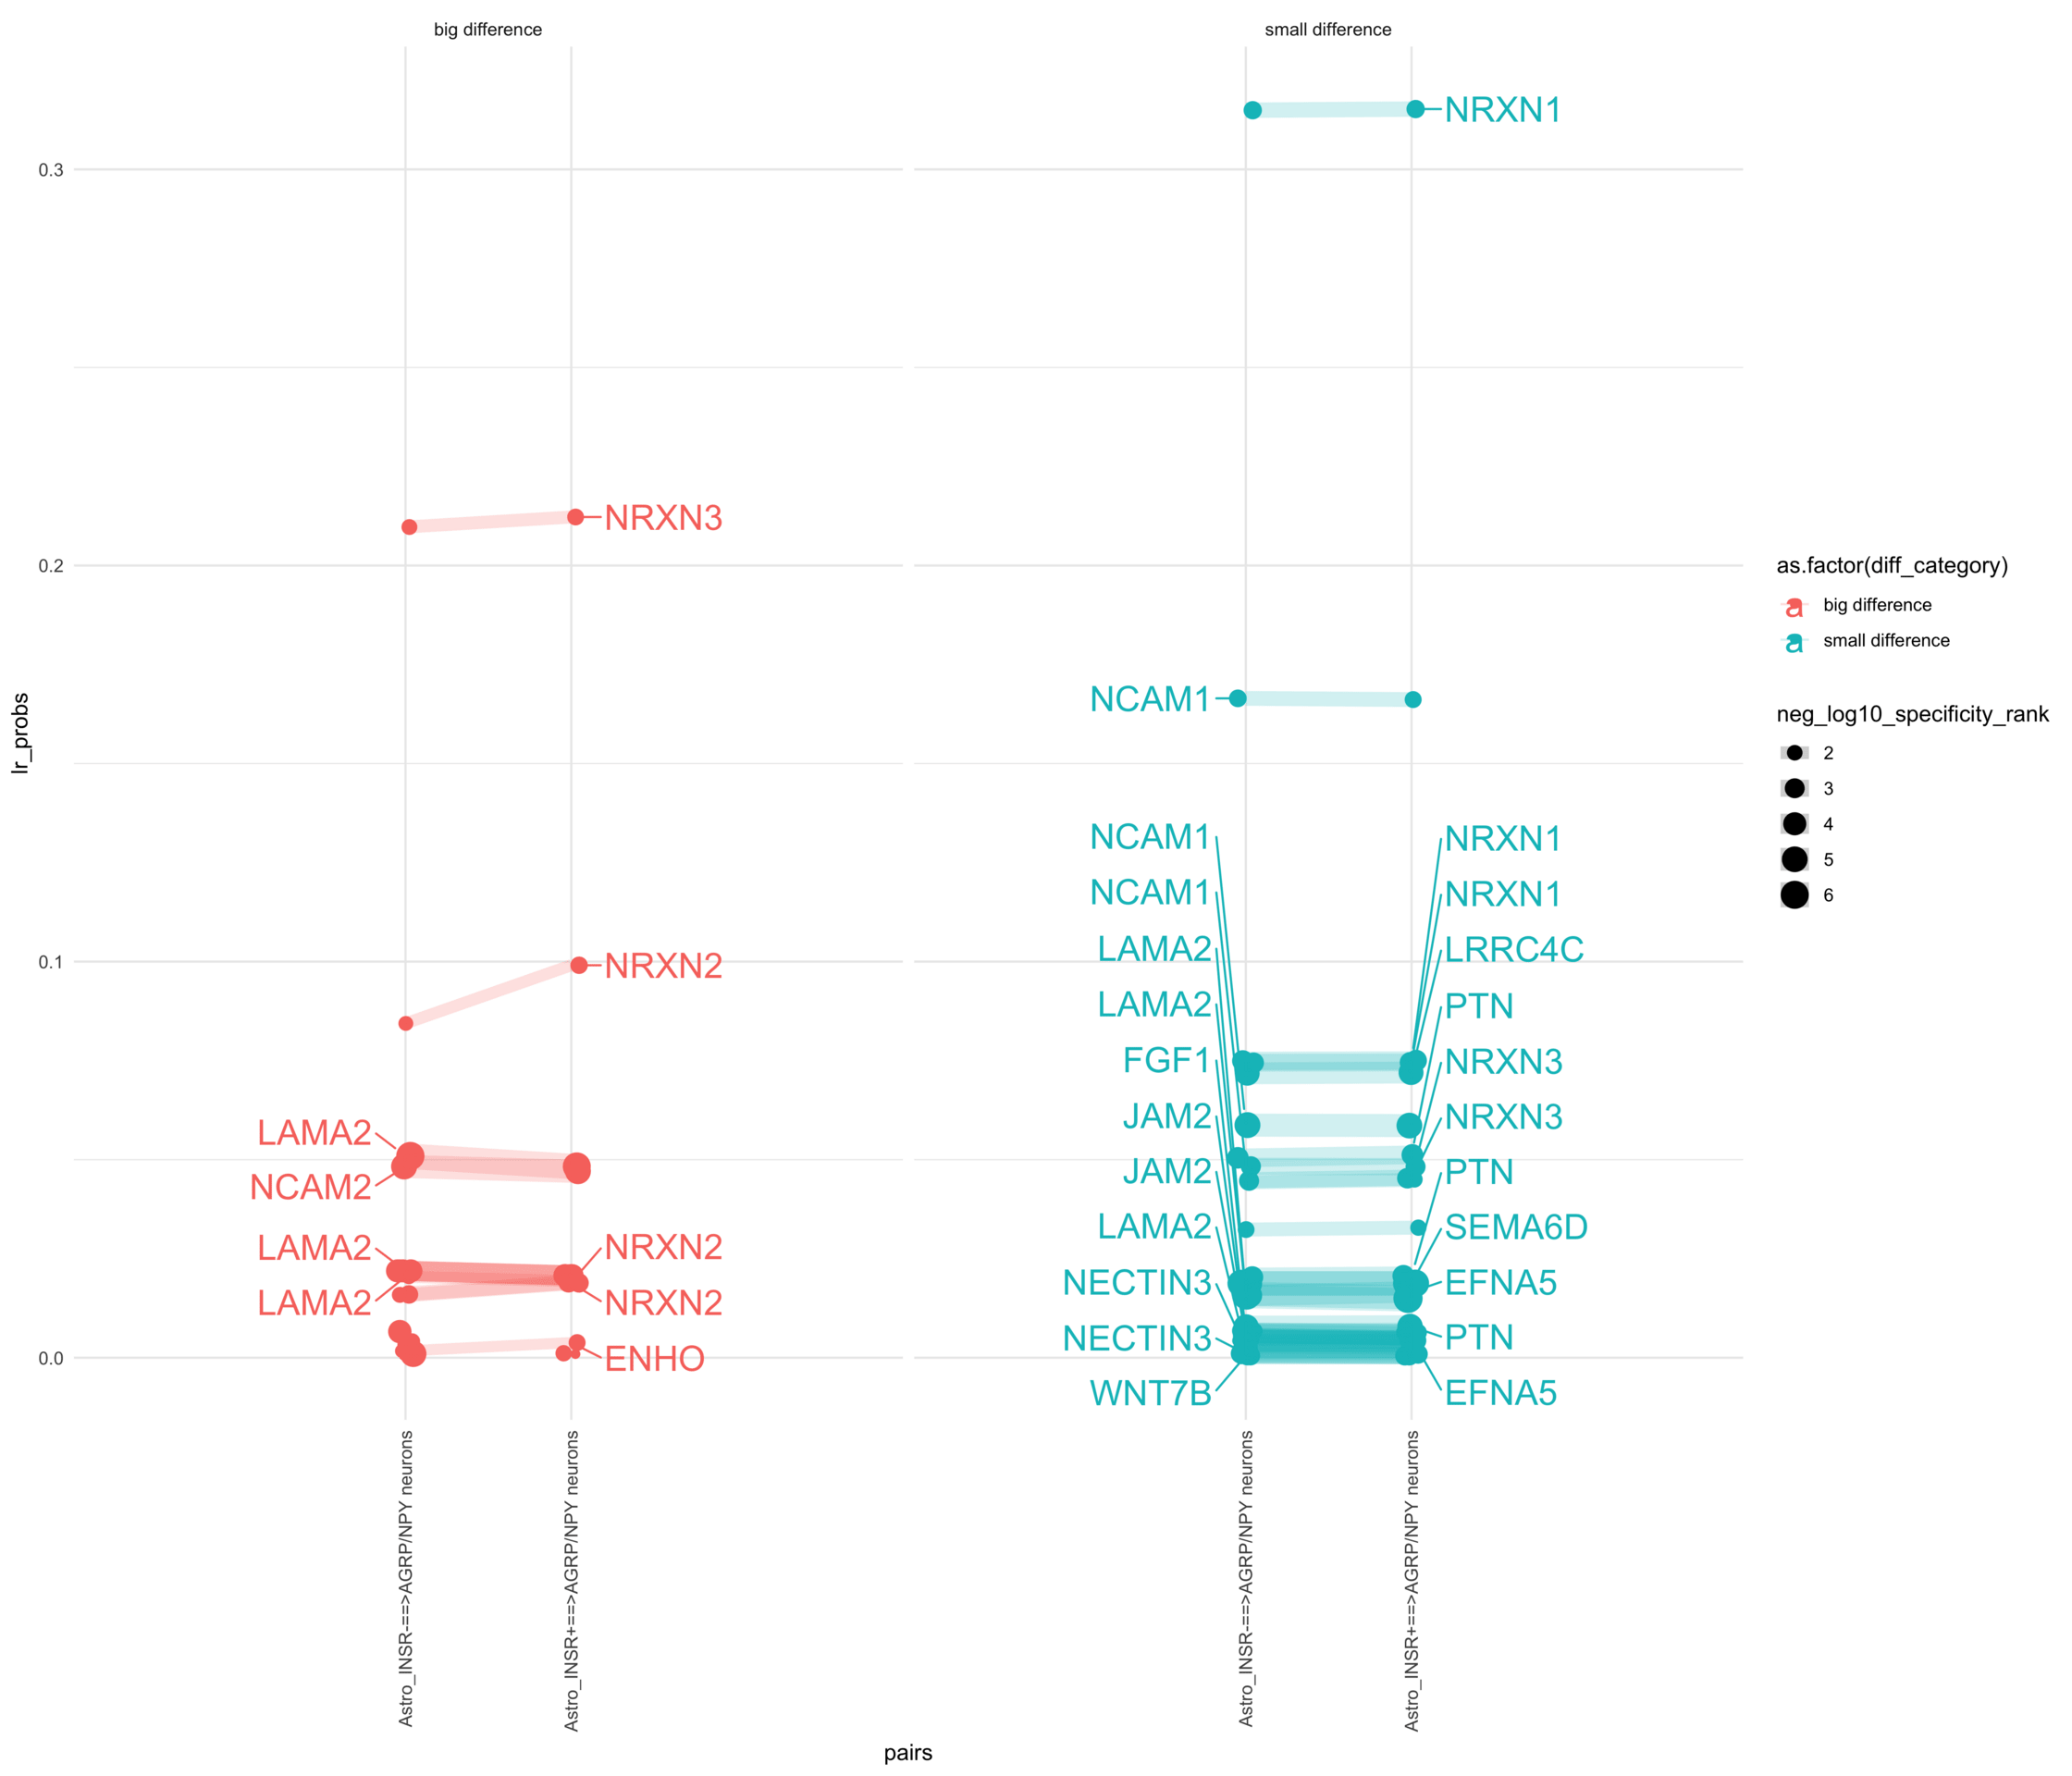
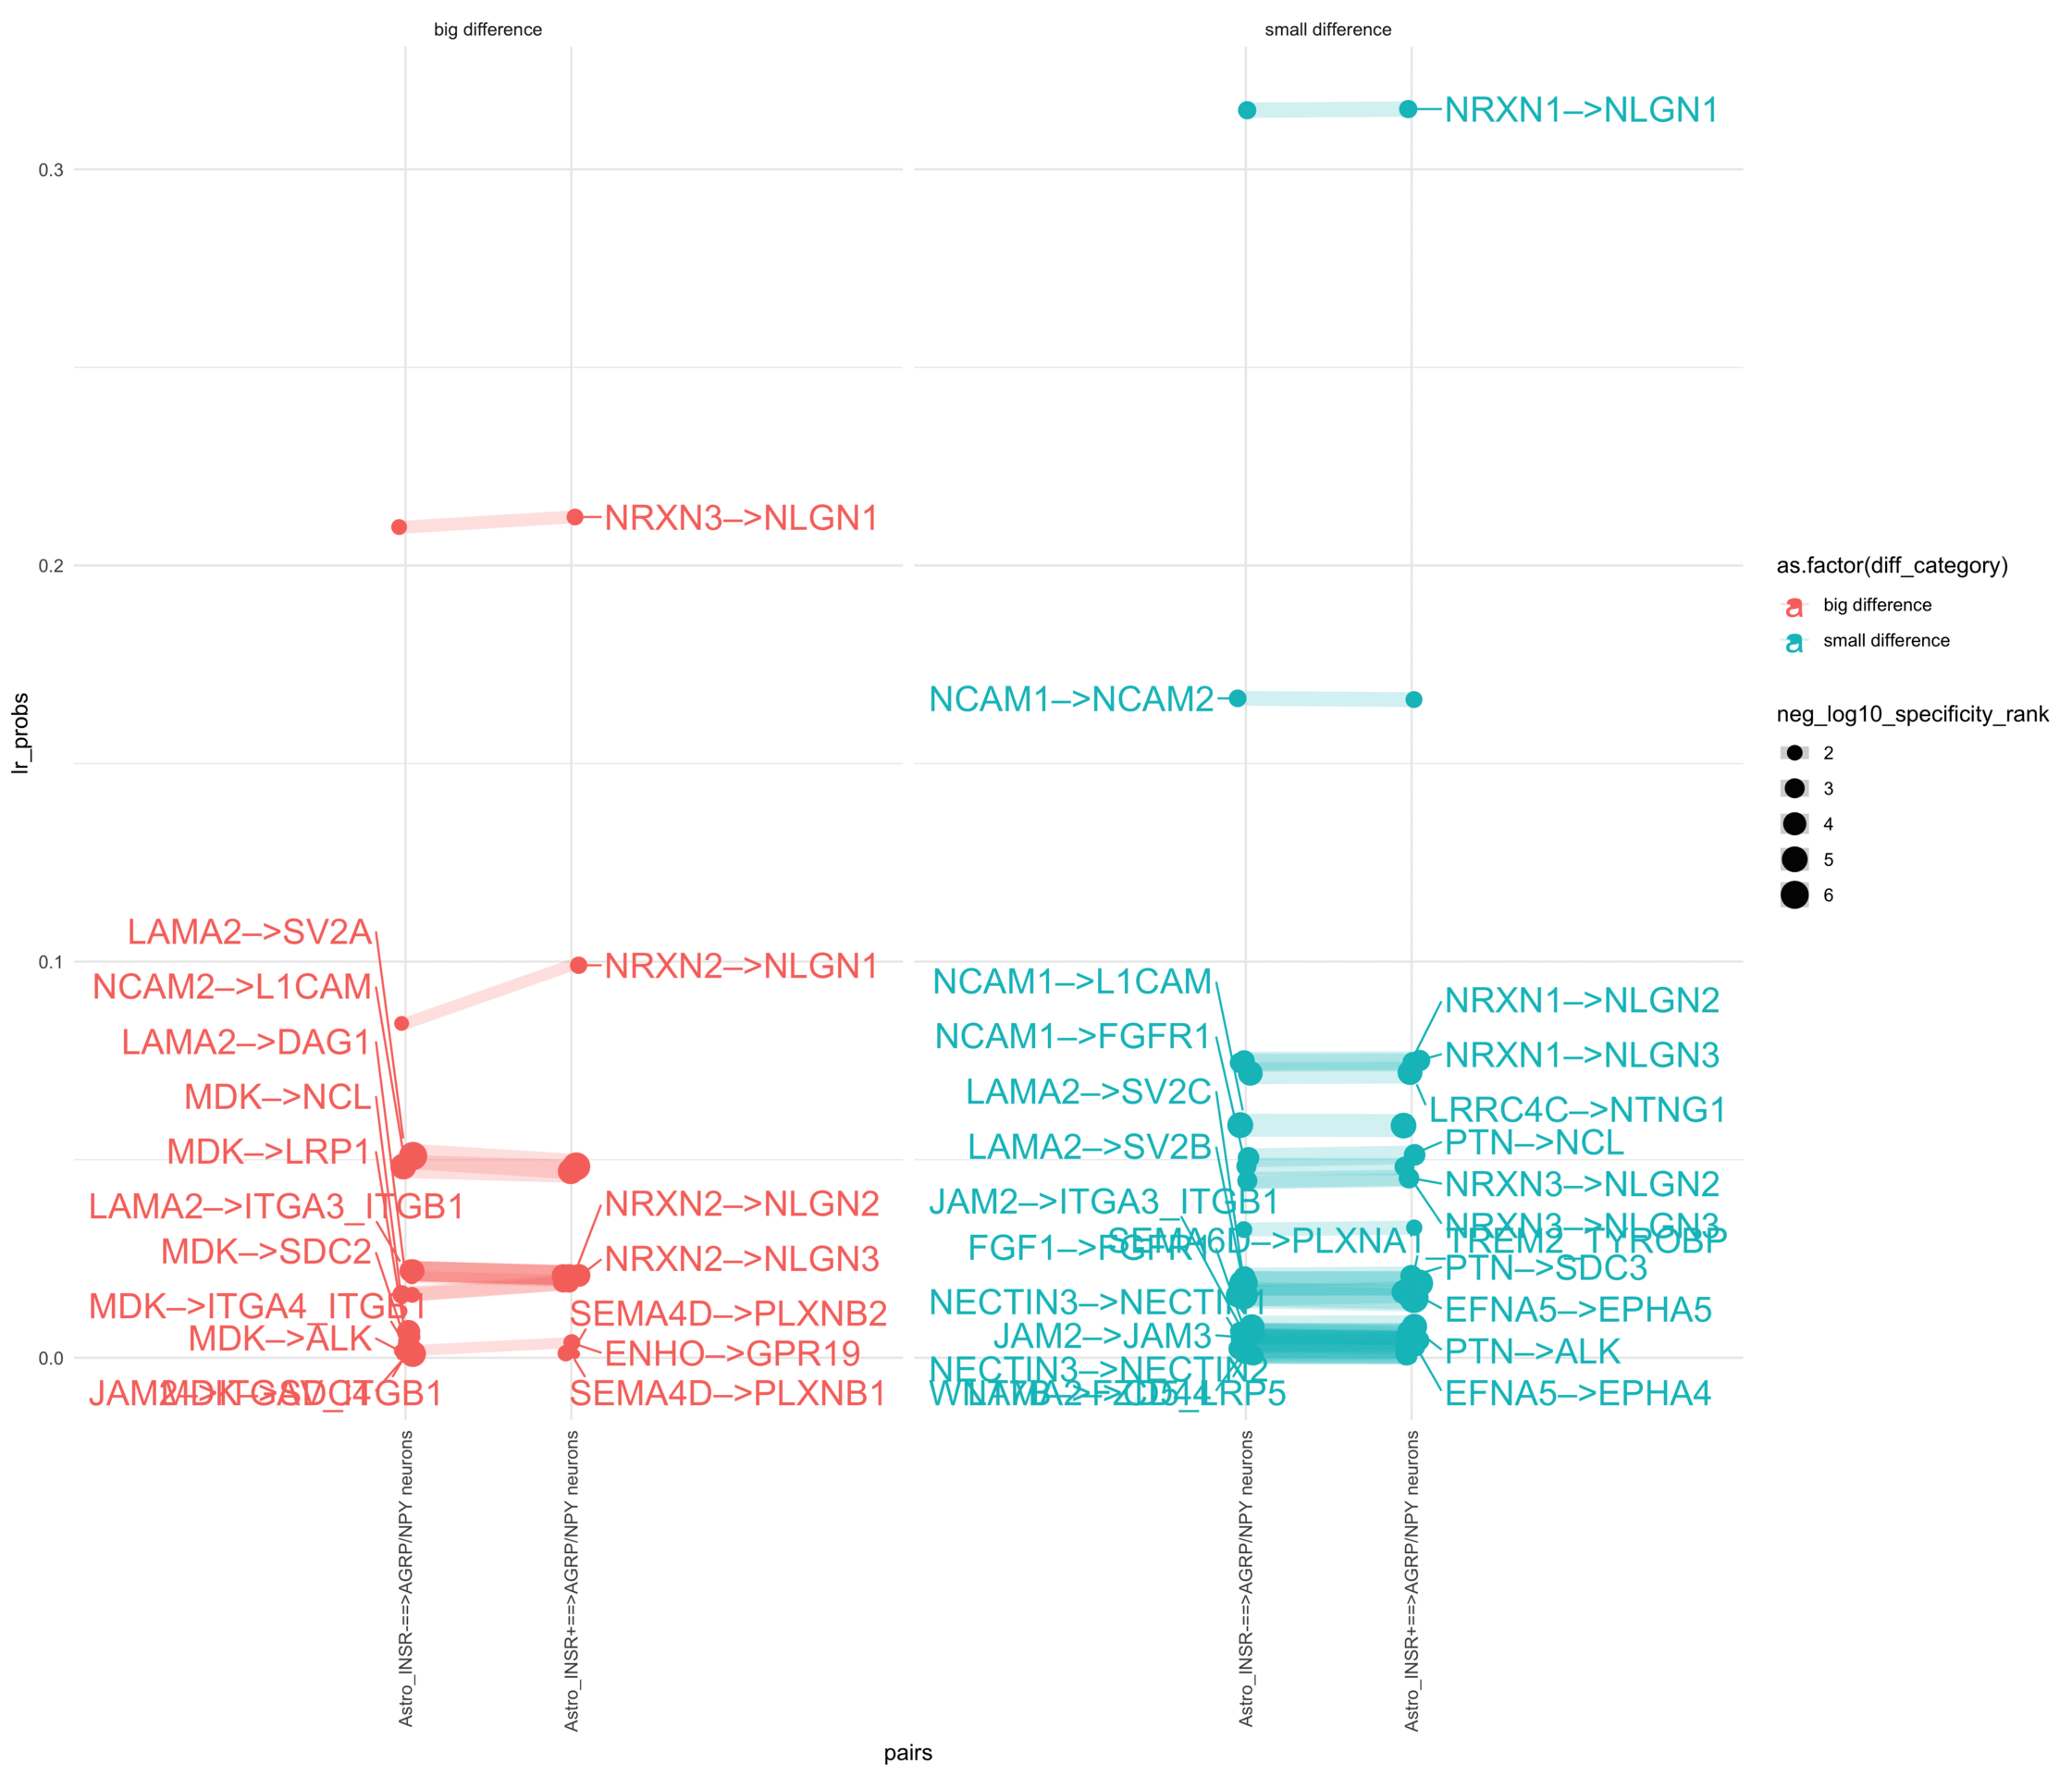
How do insuline receptor positive or negative astrocytes coupled with AGRP/NPY neurons?
# Reshape the dataframe back to a long formatdf_long <- df_wide %>%pivot_longer(cols =c(`Astro_INSR+==>AGRP/NPY neurons`, `Astro_INSR-==>AGRP/NPY neurons`), names_to ="pairs", values_to ="lr_probs") %>%full_join(df_specificity, by =c("pairs", "lr_complex", "ligand_complex", "receptor_complex", "control"))df_long
# Generate the plotpr <-ggplot(df_long, aes(x = pairs, y = lr_probs, color =as.factor(diff_category), size = neg_log10_specificity_rank)) +geom_jitter(width =0.05) +geom_line(aes(group = lr_complex), linetype ="solid", alpha =0.2) +theme_minimal() +theme(axis.text.x =element_text(angle =90, vjust =0.5, hjust =1)) +facet_wrap(~diff_category)# Add text labels for min and max 5 values within each group using ggrepelpr <- pr +geom_text_repel(data = top_bot_10 %>%filter( pairs =="Astro_INSR+==>AGRP/NPY neurons", diff_rank >=0 ),aes(label = receptor_complex,point.size = neg_log10_specificity_rank ), # data point sizenudge_x =0.2, direction ="y", hjust ="left",size =6, # font size in the text labelspoint.padding =0.2, # additional padding around each pointmin.segment.length =0, # draw all line segmentsmax.time =5, max.iter =1e6, # stop after 1 second, or after 100,000 iterationsseed = reseed,max.overlaps =Inf,box.padding =0.5) +geom_text_repel(data = top_bot_10 %>%filter( pairs =="Astro_INSR-==>AGRP/NPY neurons", diff_rank <=0 ),aes(label = receptor_complex,point.size = neg_log10_specificity_rank ), # data point sizenudge_x =-.2, direction ="y", hjust ="right",size =6, # font size in the text labelspoint.padding =0.2, # additional padding around each pointmin.segment.length =0, # draw all line segmentsmax.time =5, max.iter =1e6, # stop after 1 second, or after 100,000 iterationsseed = reseed,max.overlaps =Inf,box.padding =0.5) +scale_x_discrete(expand =expansion(add =2))print(pr)
Code
pl <-ggplot(df_long, aes(x = pairs, y = lr_probs, color =as.factor(diff_category), size = neg_log10_specificity_rank)) +geom_jitter(width =0.05) +geom_line(aes(group = lr_complex), linetype ="solid", alpha =0.2) +theme_minimal() +theme(axis.text.x =element_text(angle =90, vjust =0.5, hjust =1)) +facet_wrap(~diff_category)# Add text labels for min and max 5 values within each group using ggrepelpl <- pl +geom_text_repel(data = top_bot_10 %>%filter( pairs =="Astro_INSR+==>AGRP/NPY neurons", diff_rank >=0 ),aes(label = ligand_complex,point.size = neg_log10_specificity_rank ), # data point sizenudge_x =0.2, direction ="y", hjust ="left",size =6, # font size in the text labelspoint.padding =0.2, # additional padding around each pointmin.segment.length =0, # draw all line segmentsmax.time =5, max.iter =1e6, # stop after 1 second, or after 100,000 iterationsseed = reseed,max.overlaps =Inf,box.padding =0.5) +geom_text_repel(data = top_bot_10 %>%filter( pairs =="Astro_INSR-==>AGRP/NPY neurons", diff_rank <=0 ),aes(label = ligand_complex,point.size = neg_log10_specificity_rank ), # data point sizenudge_x =-.2, direction ="y", hjust ="right",size =6, # font size in the text labelspoint.padding =0.2, # additional padding around each pointmin.segment.length =0, # draw all line segmentsmax.time =5, max.iter =1e6, # stop after 1 second, or after 100,000 iterationsseed = reseed,max.overlaps =Inf,box.padding =0.5) +scale_x_discrete(expand =expansion(add =2))print(pl)
Code
plr <-ggplot(df_long, aes(x = pairs, y = lr_probs, color =as.factor(diff_category), size = neg_log10_specificity_rank)) +geom_jitter(width =0.05) +geom_line(aes(group = lr_complex), linetype ="solid", alpha =0.2) +theme_minimal() +theme(axis.text.x =element_text(angle =90, vjust =0.5, hjust =1)) +facet_wrap(~diff_category)# Add text labels for min and max 5 values within each group using ggrepelplr <- plr +geom_text_repel(data = top_bot_10 %>%filter( (pairs =="Astro_INSR+==>AGRP/NPY neurons"& diff_rank >=0) | (!is.na(lr_probs) & pairs =="Astro_INSR+==>AGRP/NPY neurons"&is.na(diff_rank)) ),aes(label = lr_complex,point.size = neg_log10_specificity_rank ), # data point sizenudge_x =0.2, direction ="y", hjust ="left",size =6, # font size in the text labelspoint.padding =0.2, # additional padding around each pointmin.segment.length =0, # draw all line segmentsmax.time =5, max.iter =1e6, # stop after 1 second, or after 100,000 iterationsseed = reseed,max.overlaps =Inf,box.padding =0.5) +geom_text_repel(data = top_bot_10 %>%filter( (pairs =="Astro_INSR-==>AGRP/NPY neurons"& diff_rank <=0) | (!is.na(lr_probs) & pairs =="Astro_INSR-==>AGRP/NPY neurons"&is.na(diff_rank)) ),aes(label = lr_complex,point.size = neg_log10_specificity_rank ), # data point sizenudge_x =-.2, direction ="y", hjust ="right",size =6, # font size in the text labelspoint.padding =0.2, # additional padding around each pointmin.segment.length =0, # draw all line segmentsmax.time =5, max.iter =1e6, # stop after 1 second, or after 100,000 iterationsseed = reseed,max.overlaps =Inf,box.padding =0.5) +scale_x_discrete(expand =expansion(add =2))print(plr)
Lutomska 2022
Signalling pairs
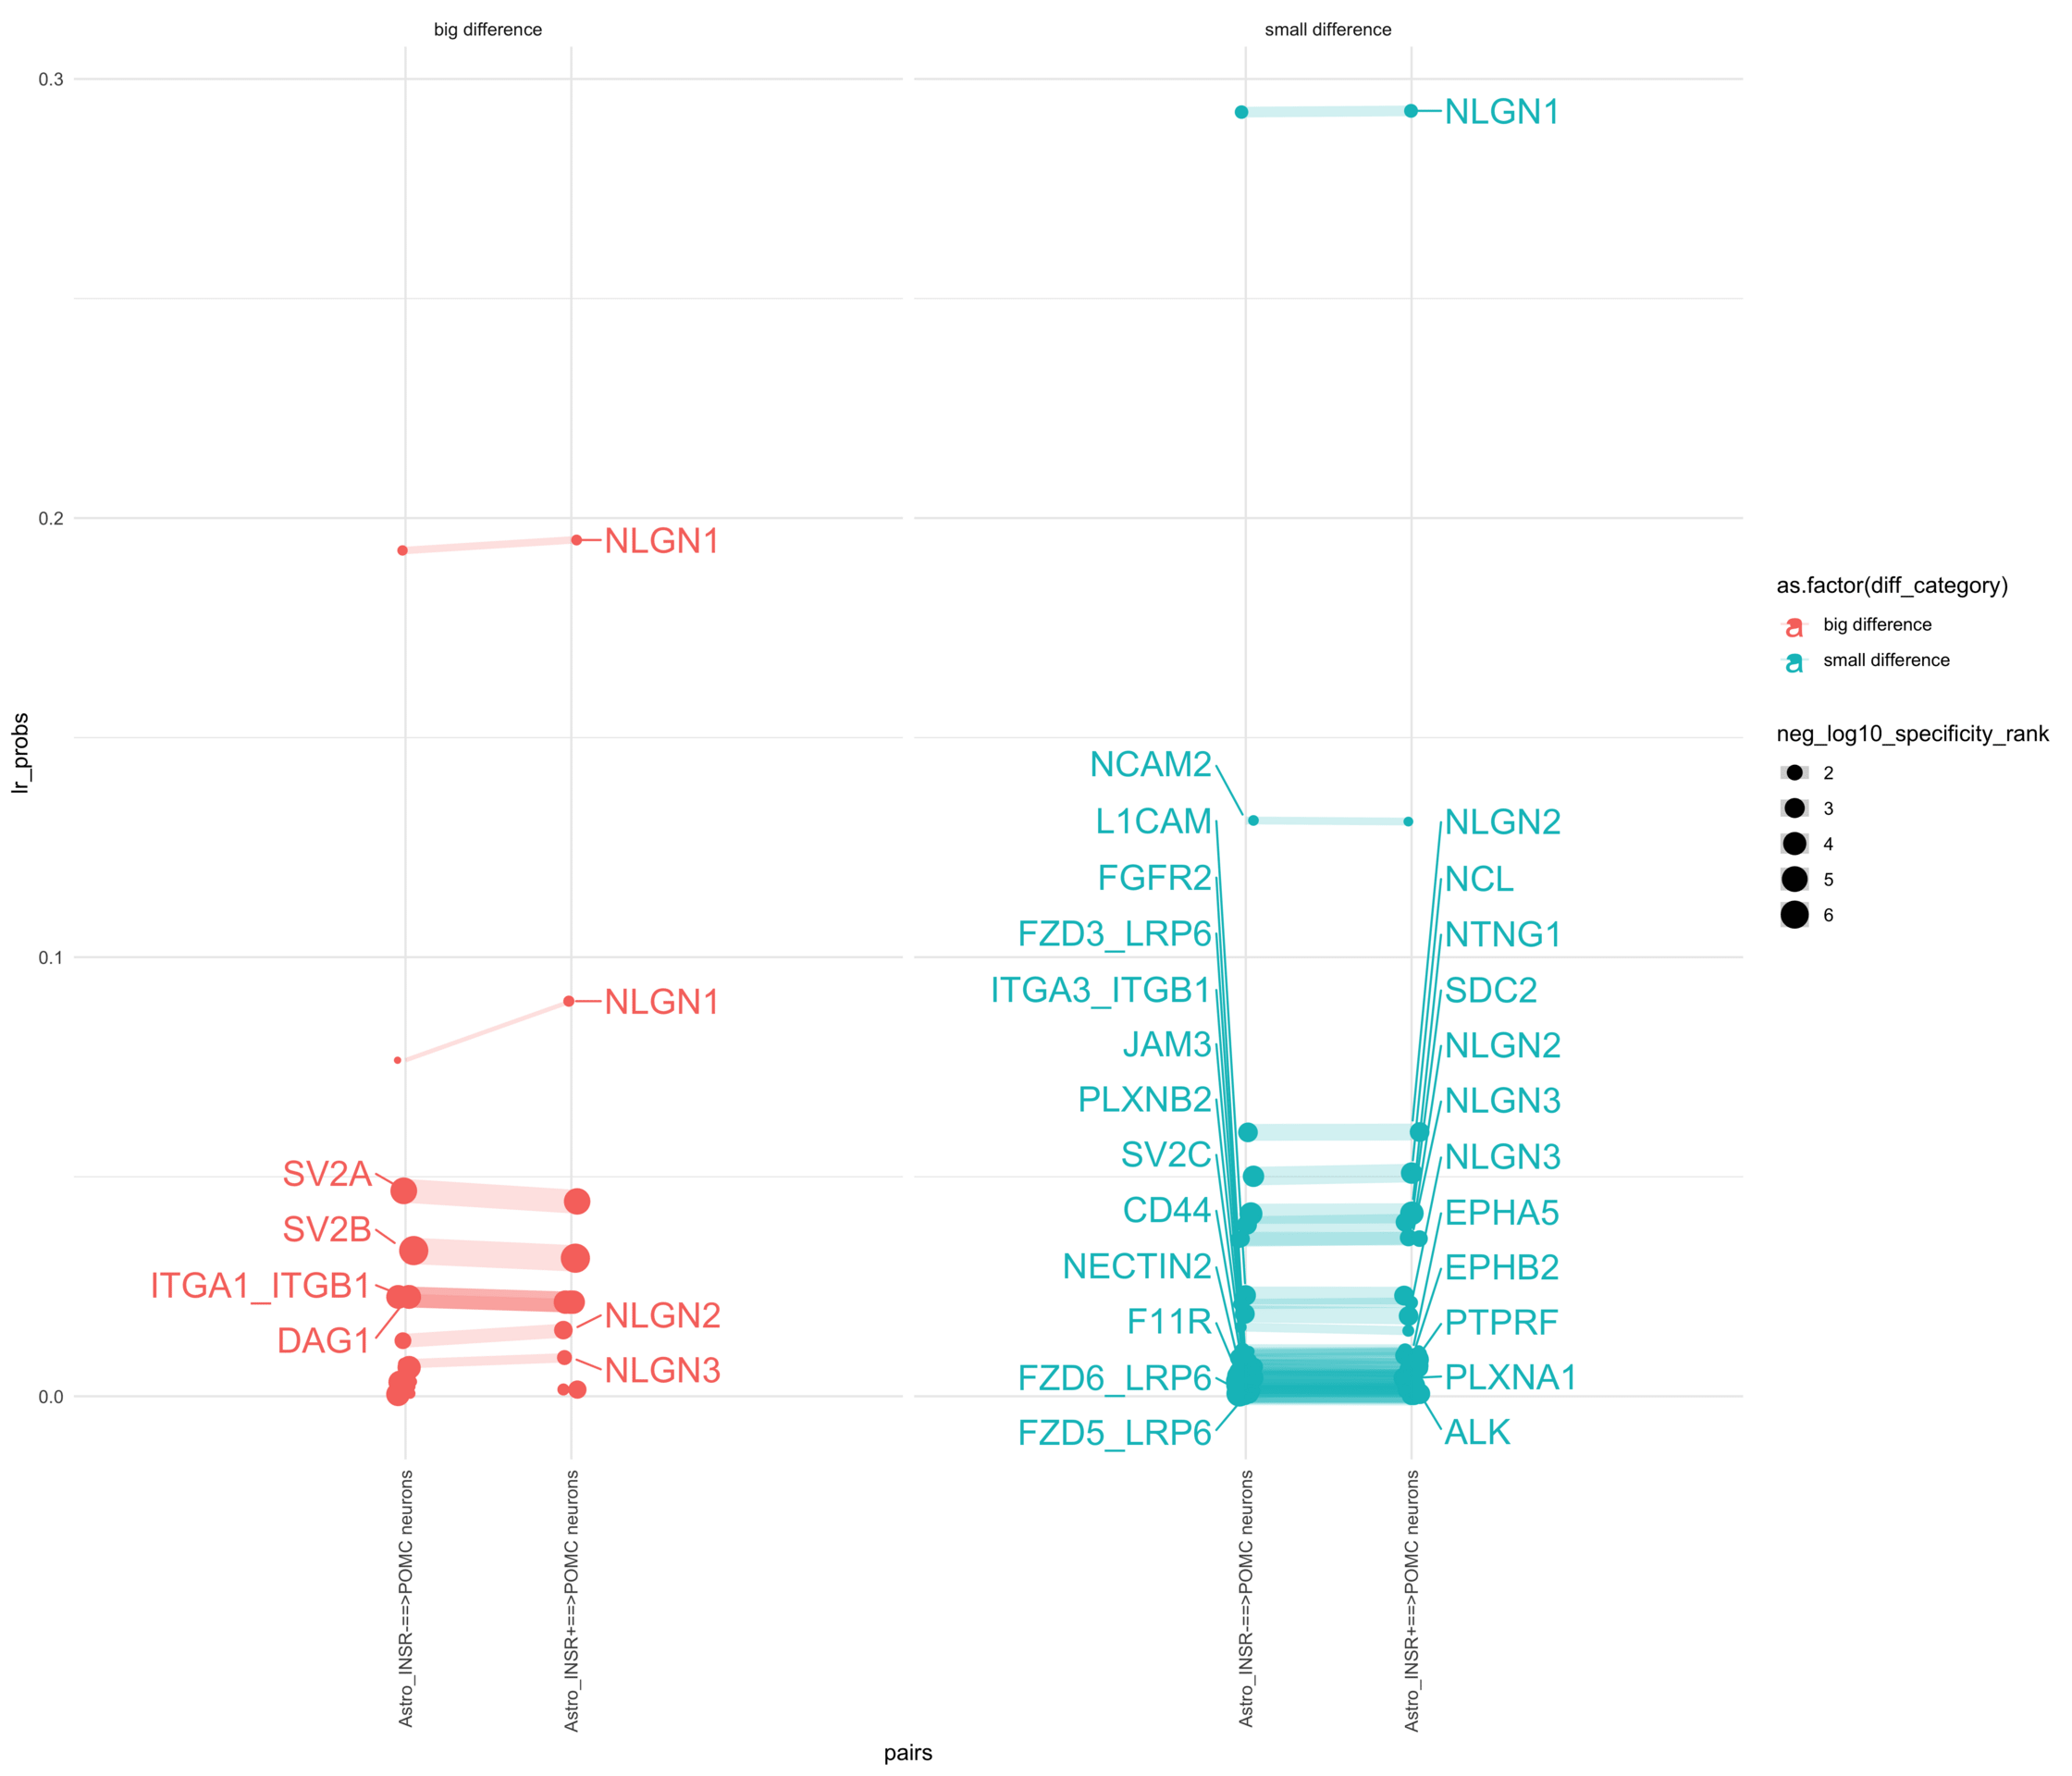
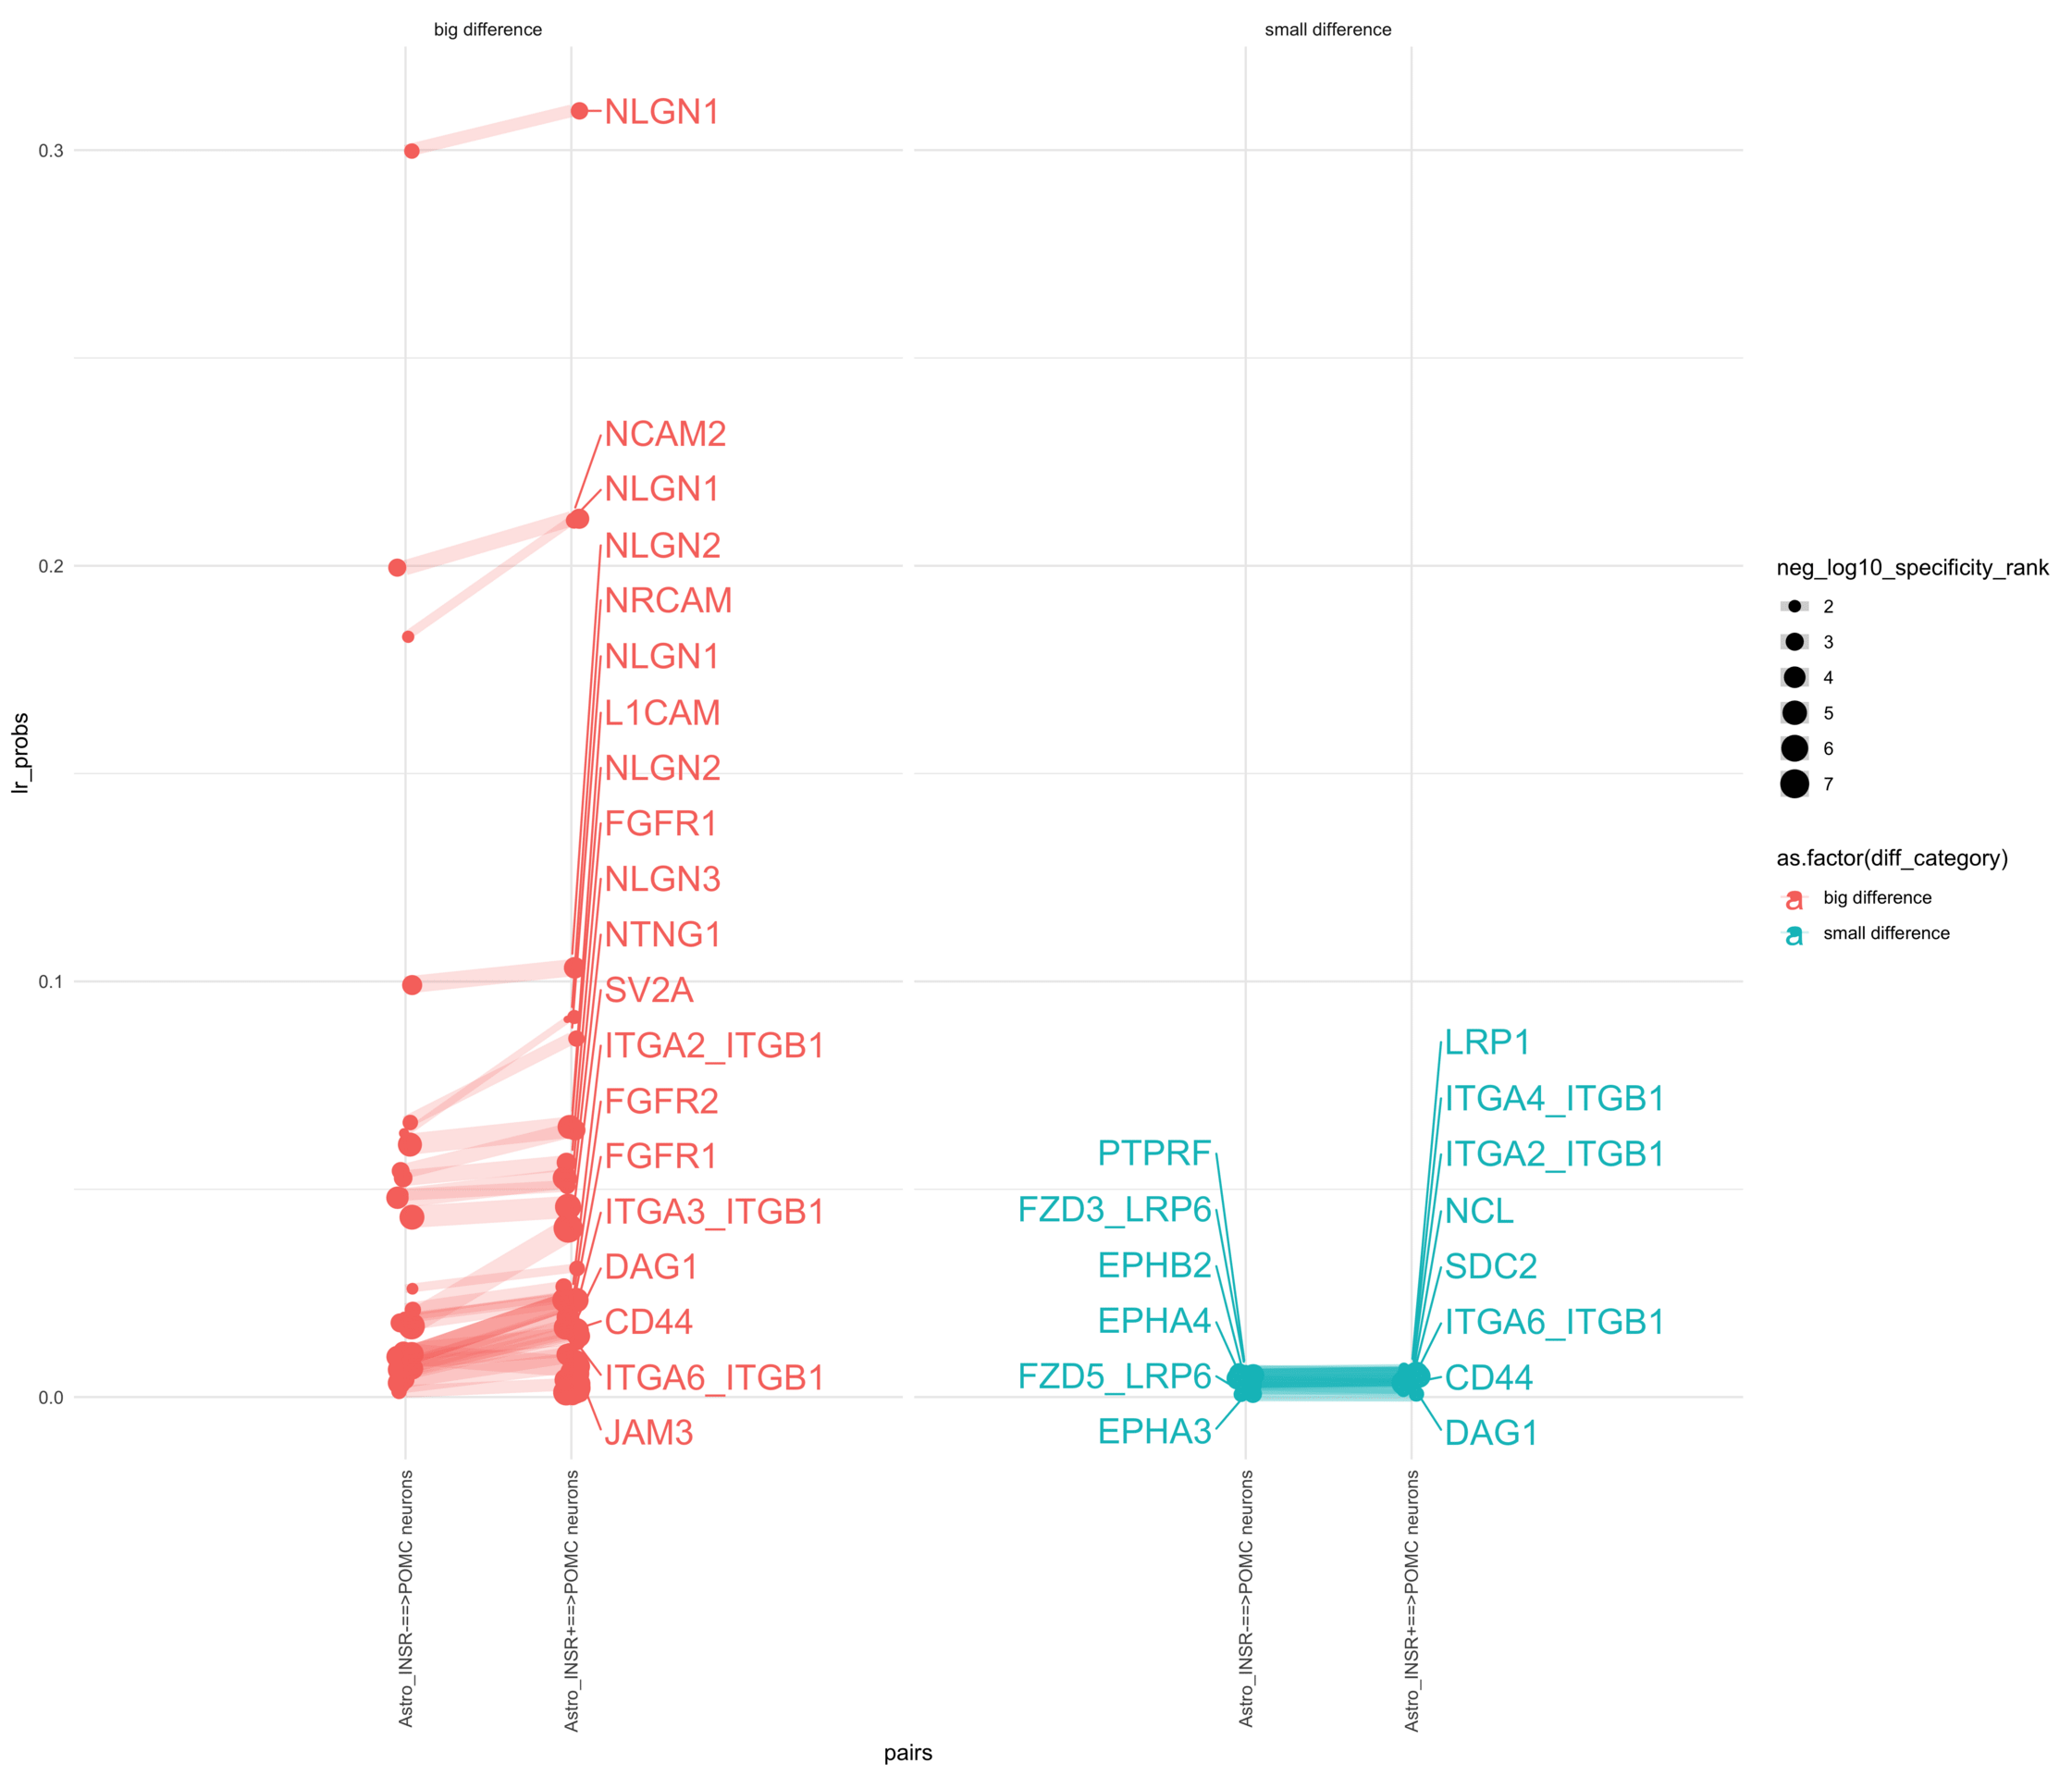
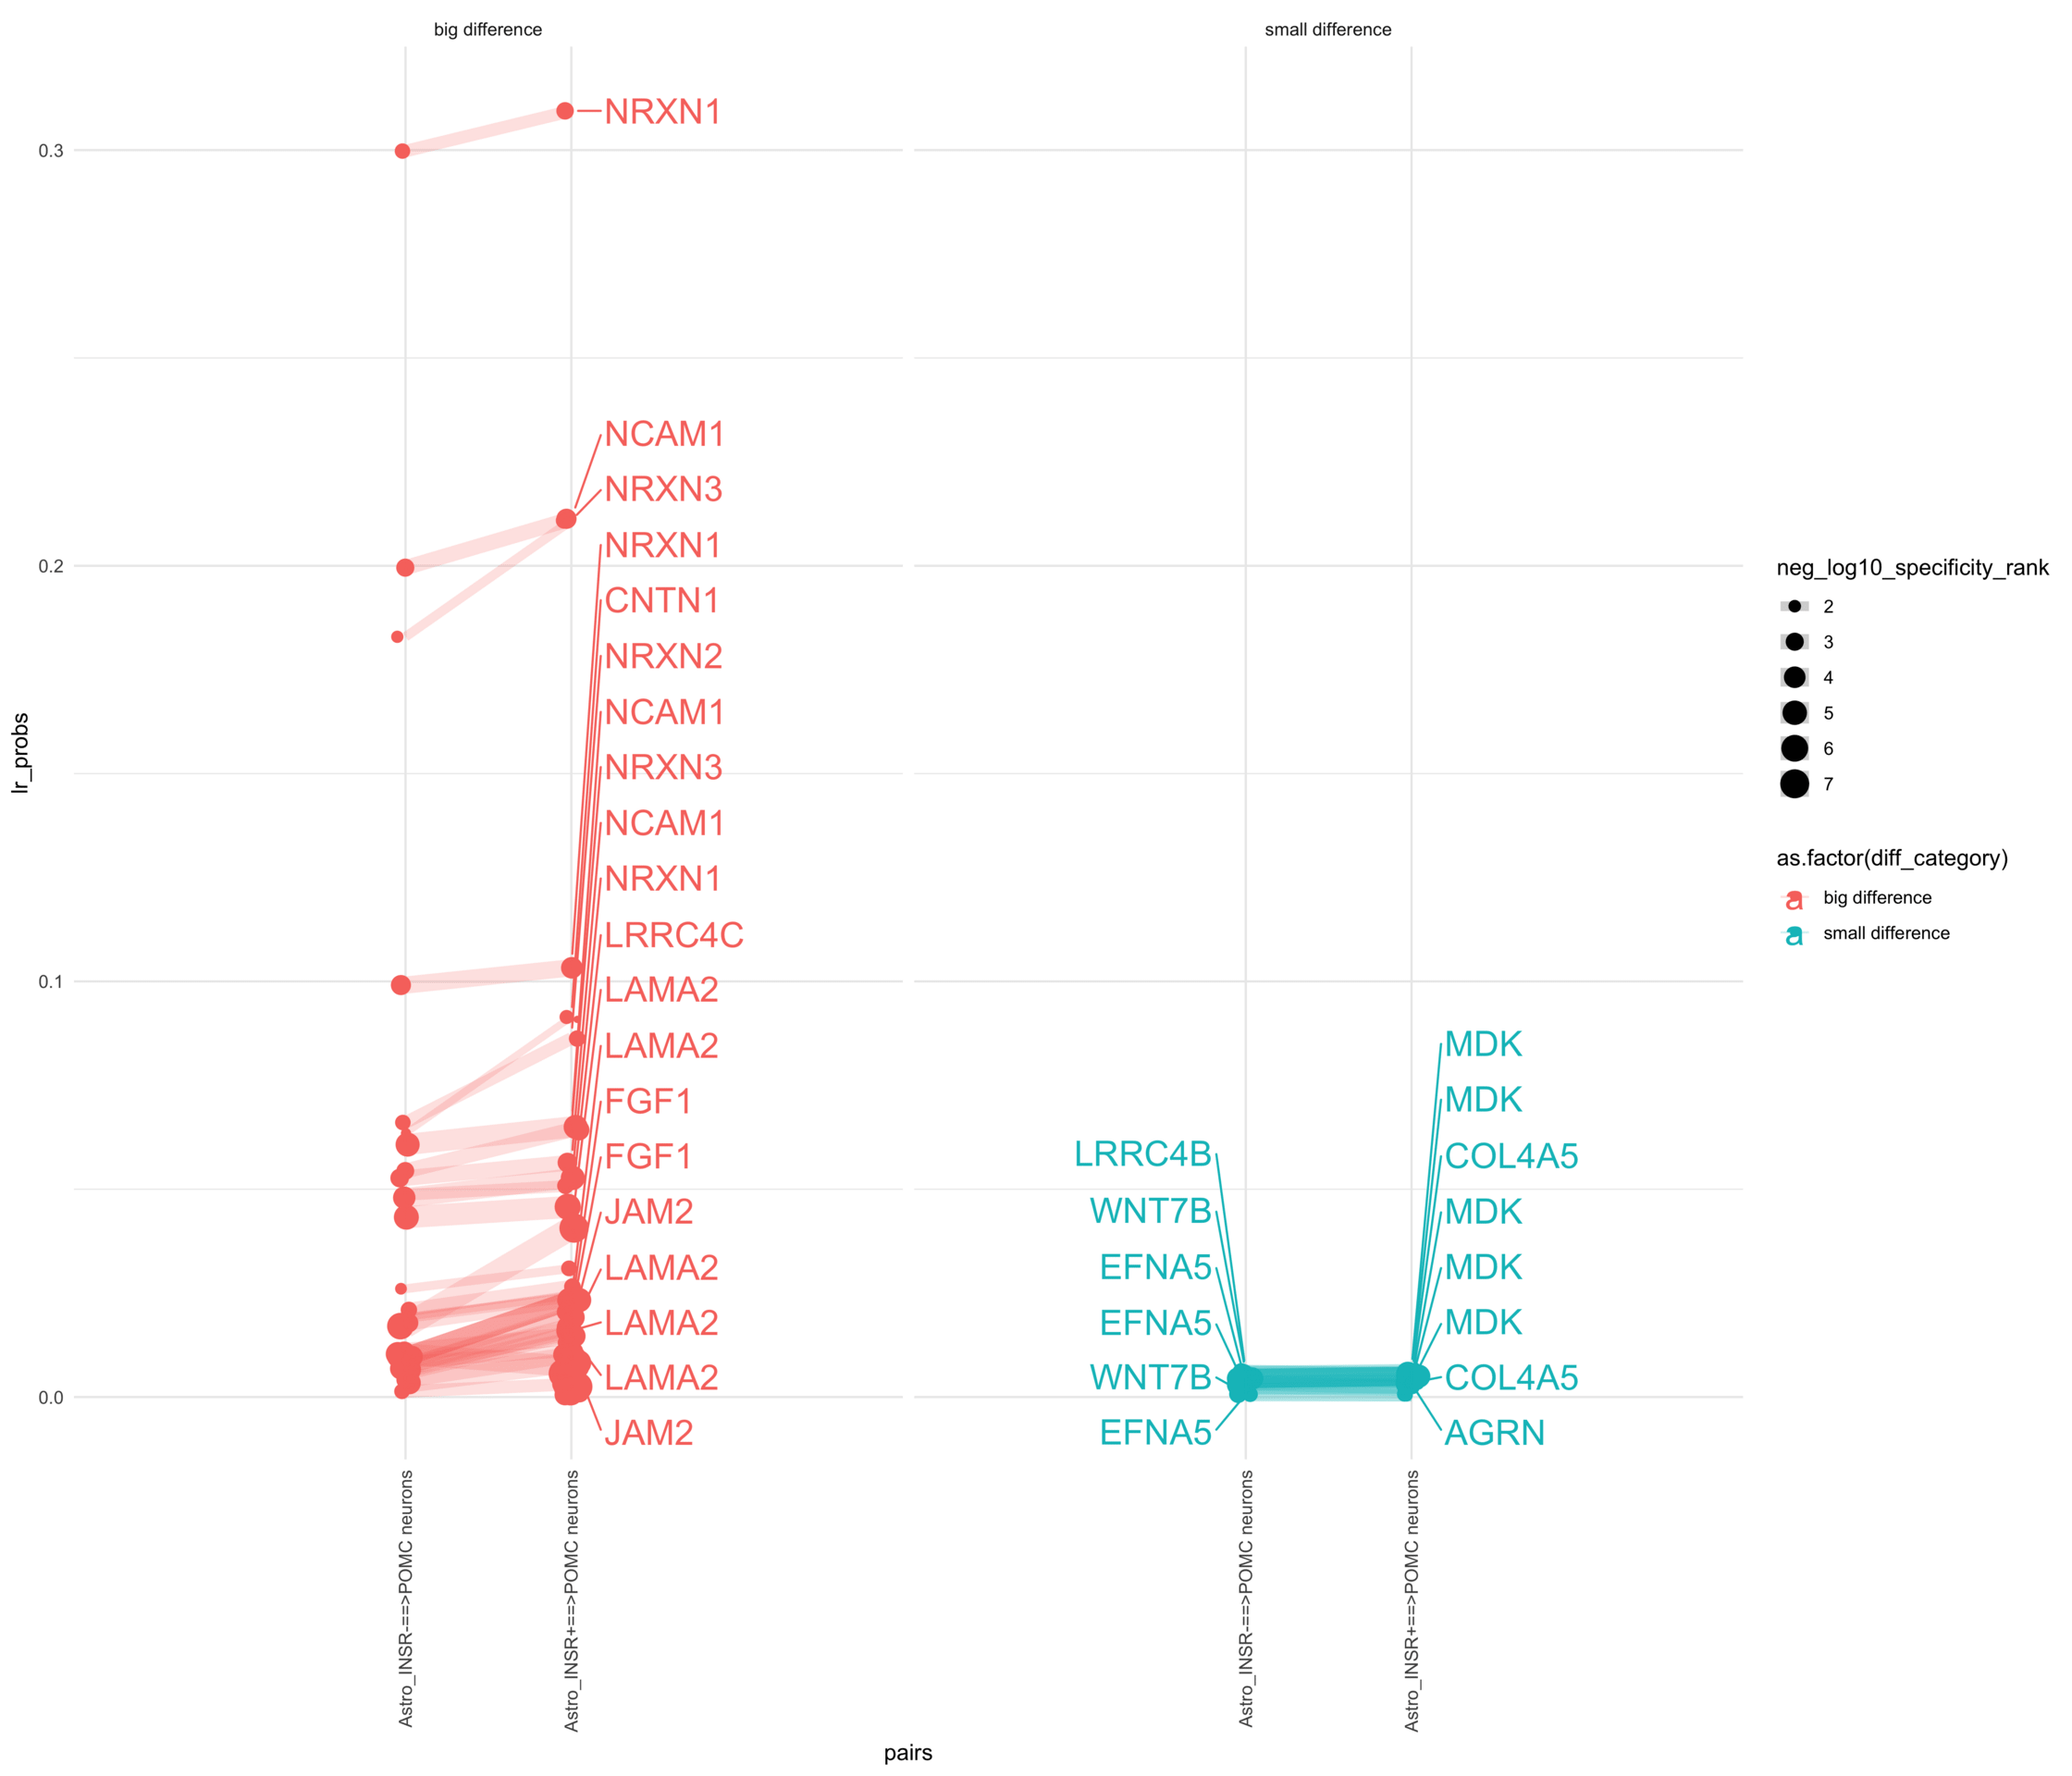
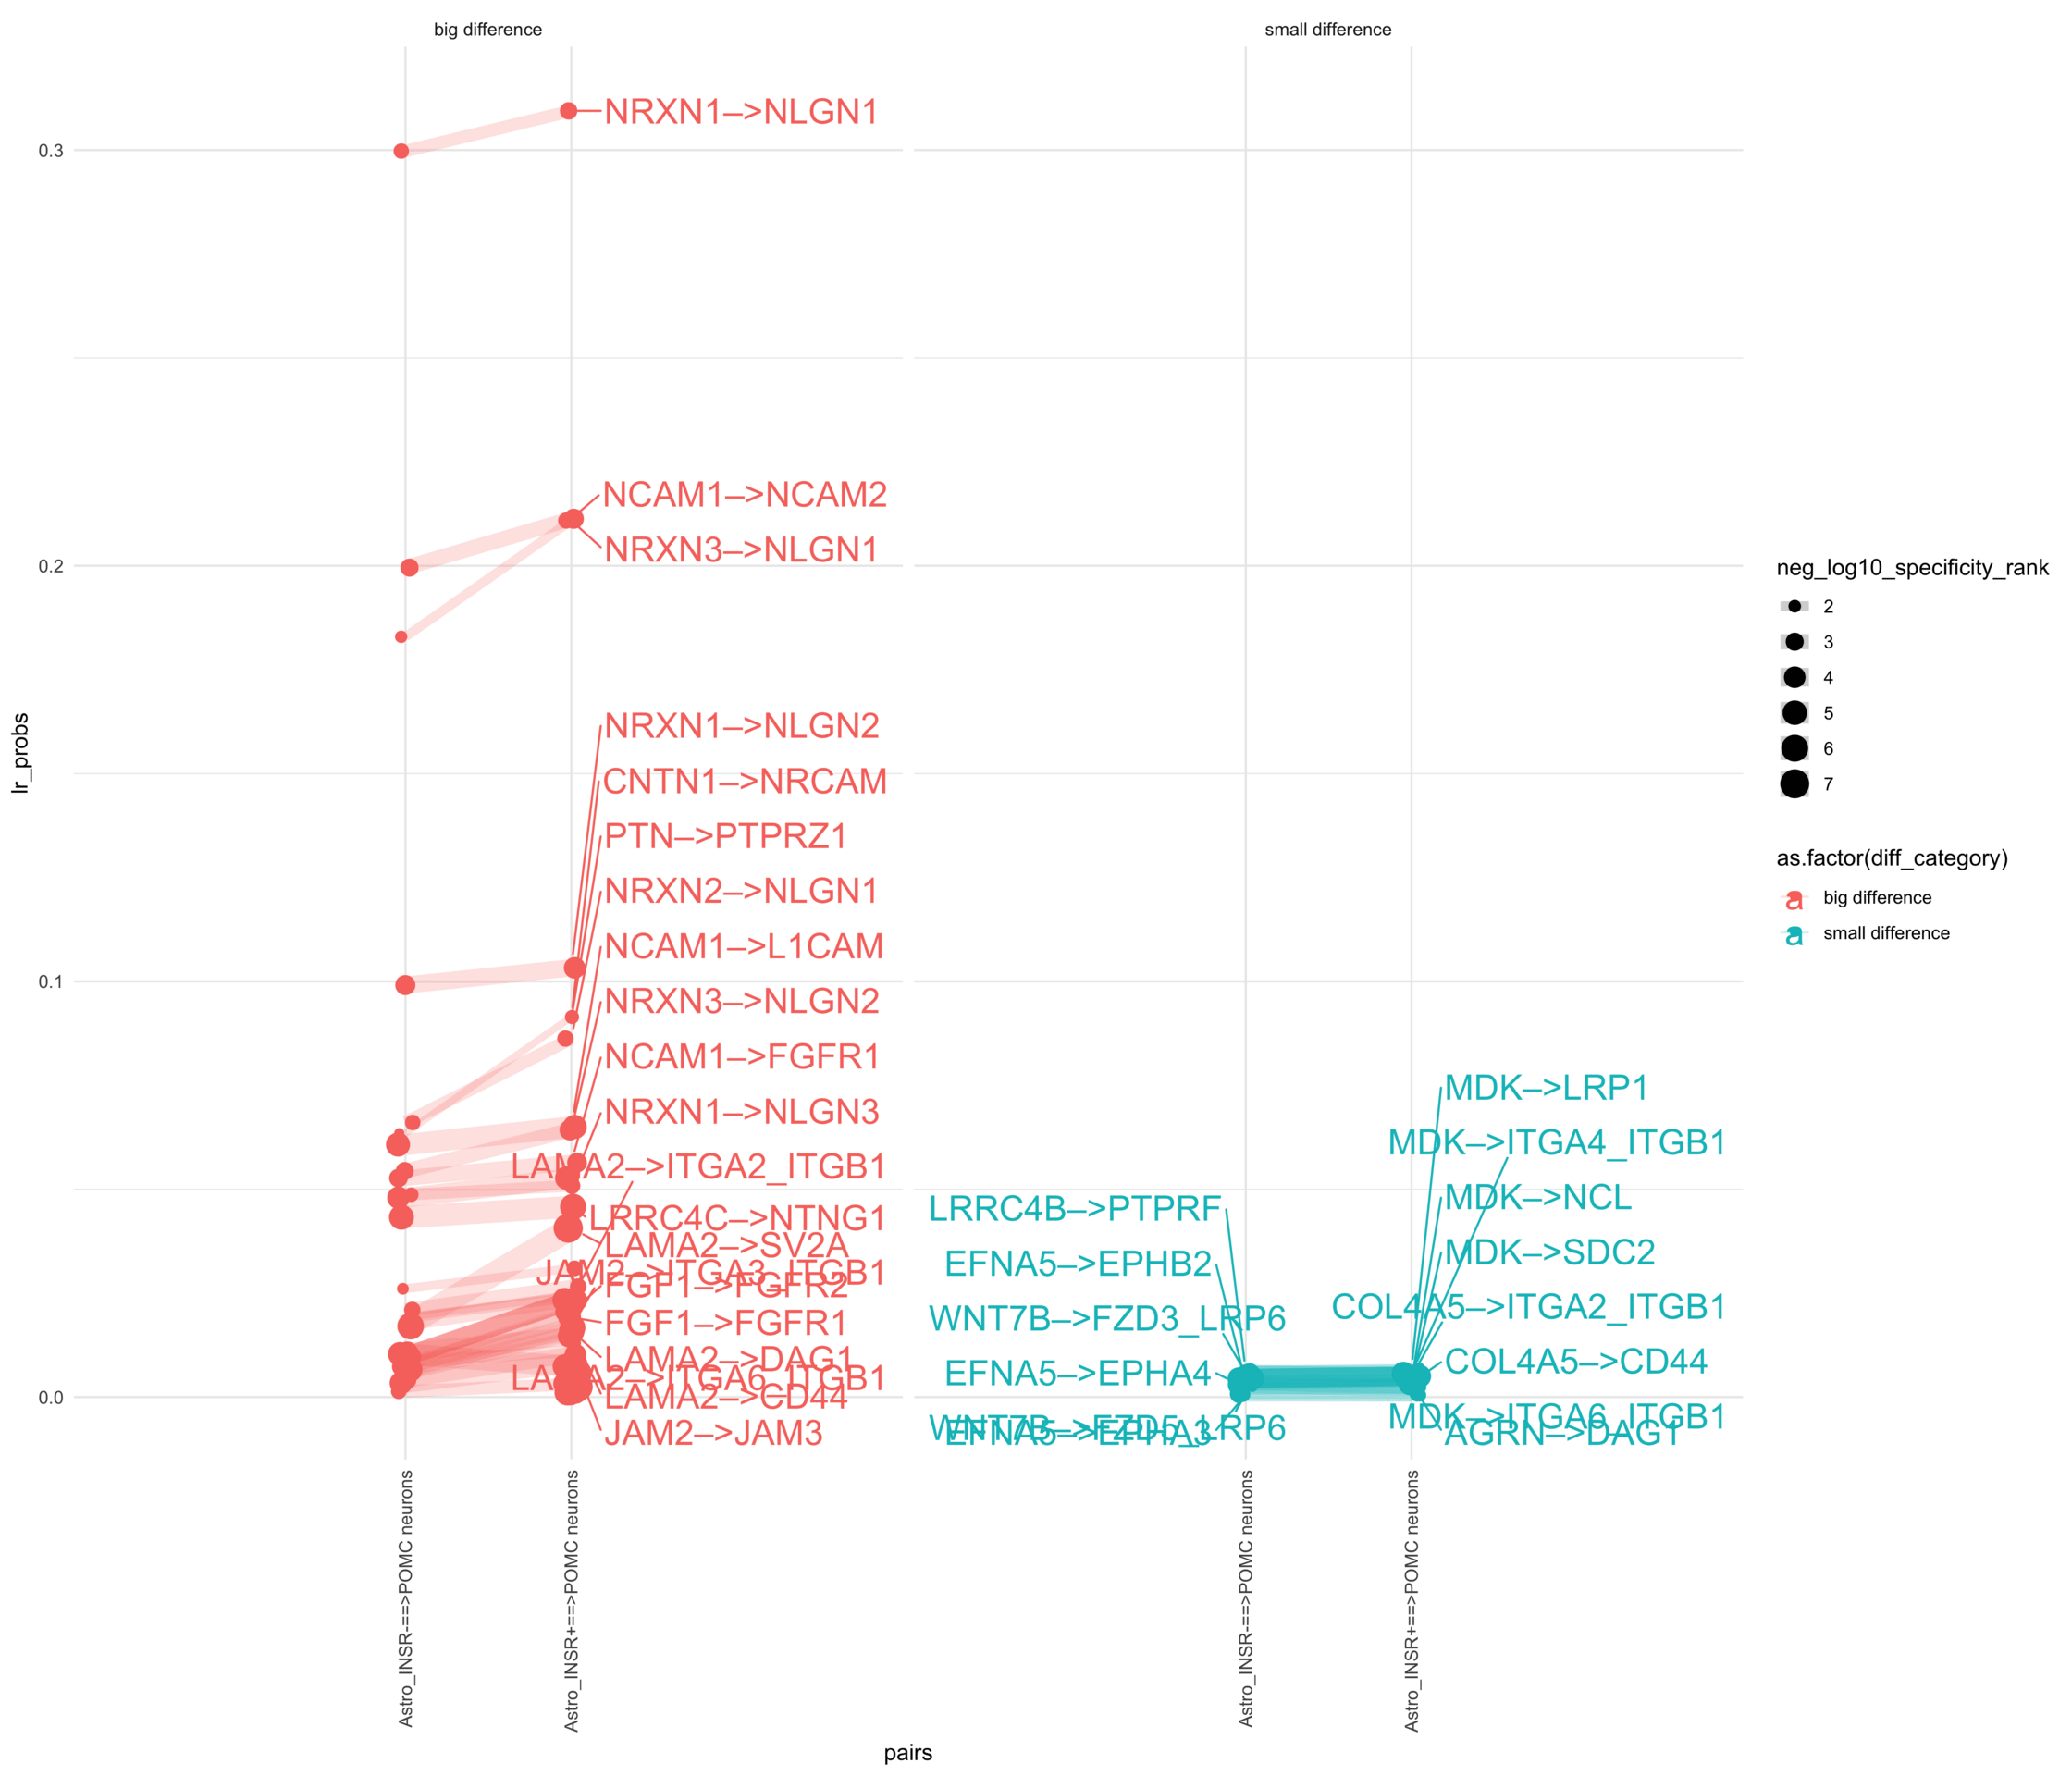
How do insuline receptor positive or negative astrocytes coupled with POMC neurons?
# Reshape the dataframe back to a long formatdf_long <- df_wide %>%pivot_longer(cols =c(`Astro_INSR+==>POMC neurons`, `Astro_INSR-==>POMC neurons`), names_to ="pairs", values_to ="lr_probs") %>%full_join(df_specificity, by =c("pairs", "lr_complex", "ligand_complex", "receptor_complex", "control"))df_long
# Generate the plotpr <-ggplot(df_long, aes(x = pairs, y = lr_probs, color =as.factor(diff_category), size = neg_log10_specificity_rank)) +geom_jitter(width =0.05) +geom_line(aes(group = lr_complex), linetype ="solid", alpha =0.2) +theme_minimal() +theme(axis.text.x =element_text(angle =90, vjust =0.5, hjust =1)) +facet_wrap(~diff_category)# Add text labels for min and max 5 values within each group using ggrepelpr <- pr +geom_text_repel(data = top_bot_10 %>%filter( pairs =="Astro_INSR+==>POMC neurons", diff_rank >=0 ),aes(label = receptor_complex,point.size = neg_log10_specificity_rank ), # data point sizenudge_x =0.2, direction ="y", hjust ="left",size =6, # font size in the text labelspoint.padding =0.2, # additional padding around each pointmin.segment.length =0, # draw all line segmentsmax.time =5, max.iter =1e6, # stop after 1 second, or after 100,000 iterationsseed = reseed,max.overlaps =Inf,box.padding =0.5) +geom_text_repel(data = top_bot_10 %>%filter( pairs =="Astro_INSR-==>POMC neurons", diff_rank <=0 ),aes(label = receptor_complex,point.size = neg_log10_specificity_rank ), # data point sizenudge_x =-.2, direction ="y", hjust ="right",size =6, # font size in the text labelspoint.padding =0.2, # additional padding around each pointmin.segment.length =0, # draw all line segmentsmax.time =5, max.iter =1e6, # stop after 1 second, or after 100,000 iterationsseed = reseed,max.overlaps =Inf,box.padding =0.5) +scale_x_discrete(expand =expansion(add =2))print(pr)
Code
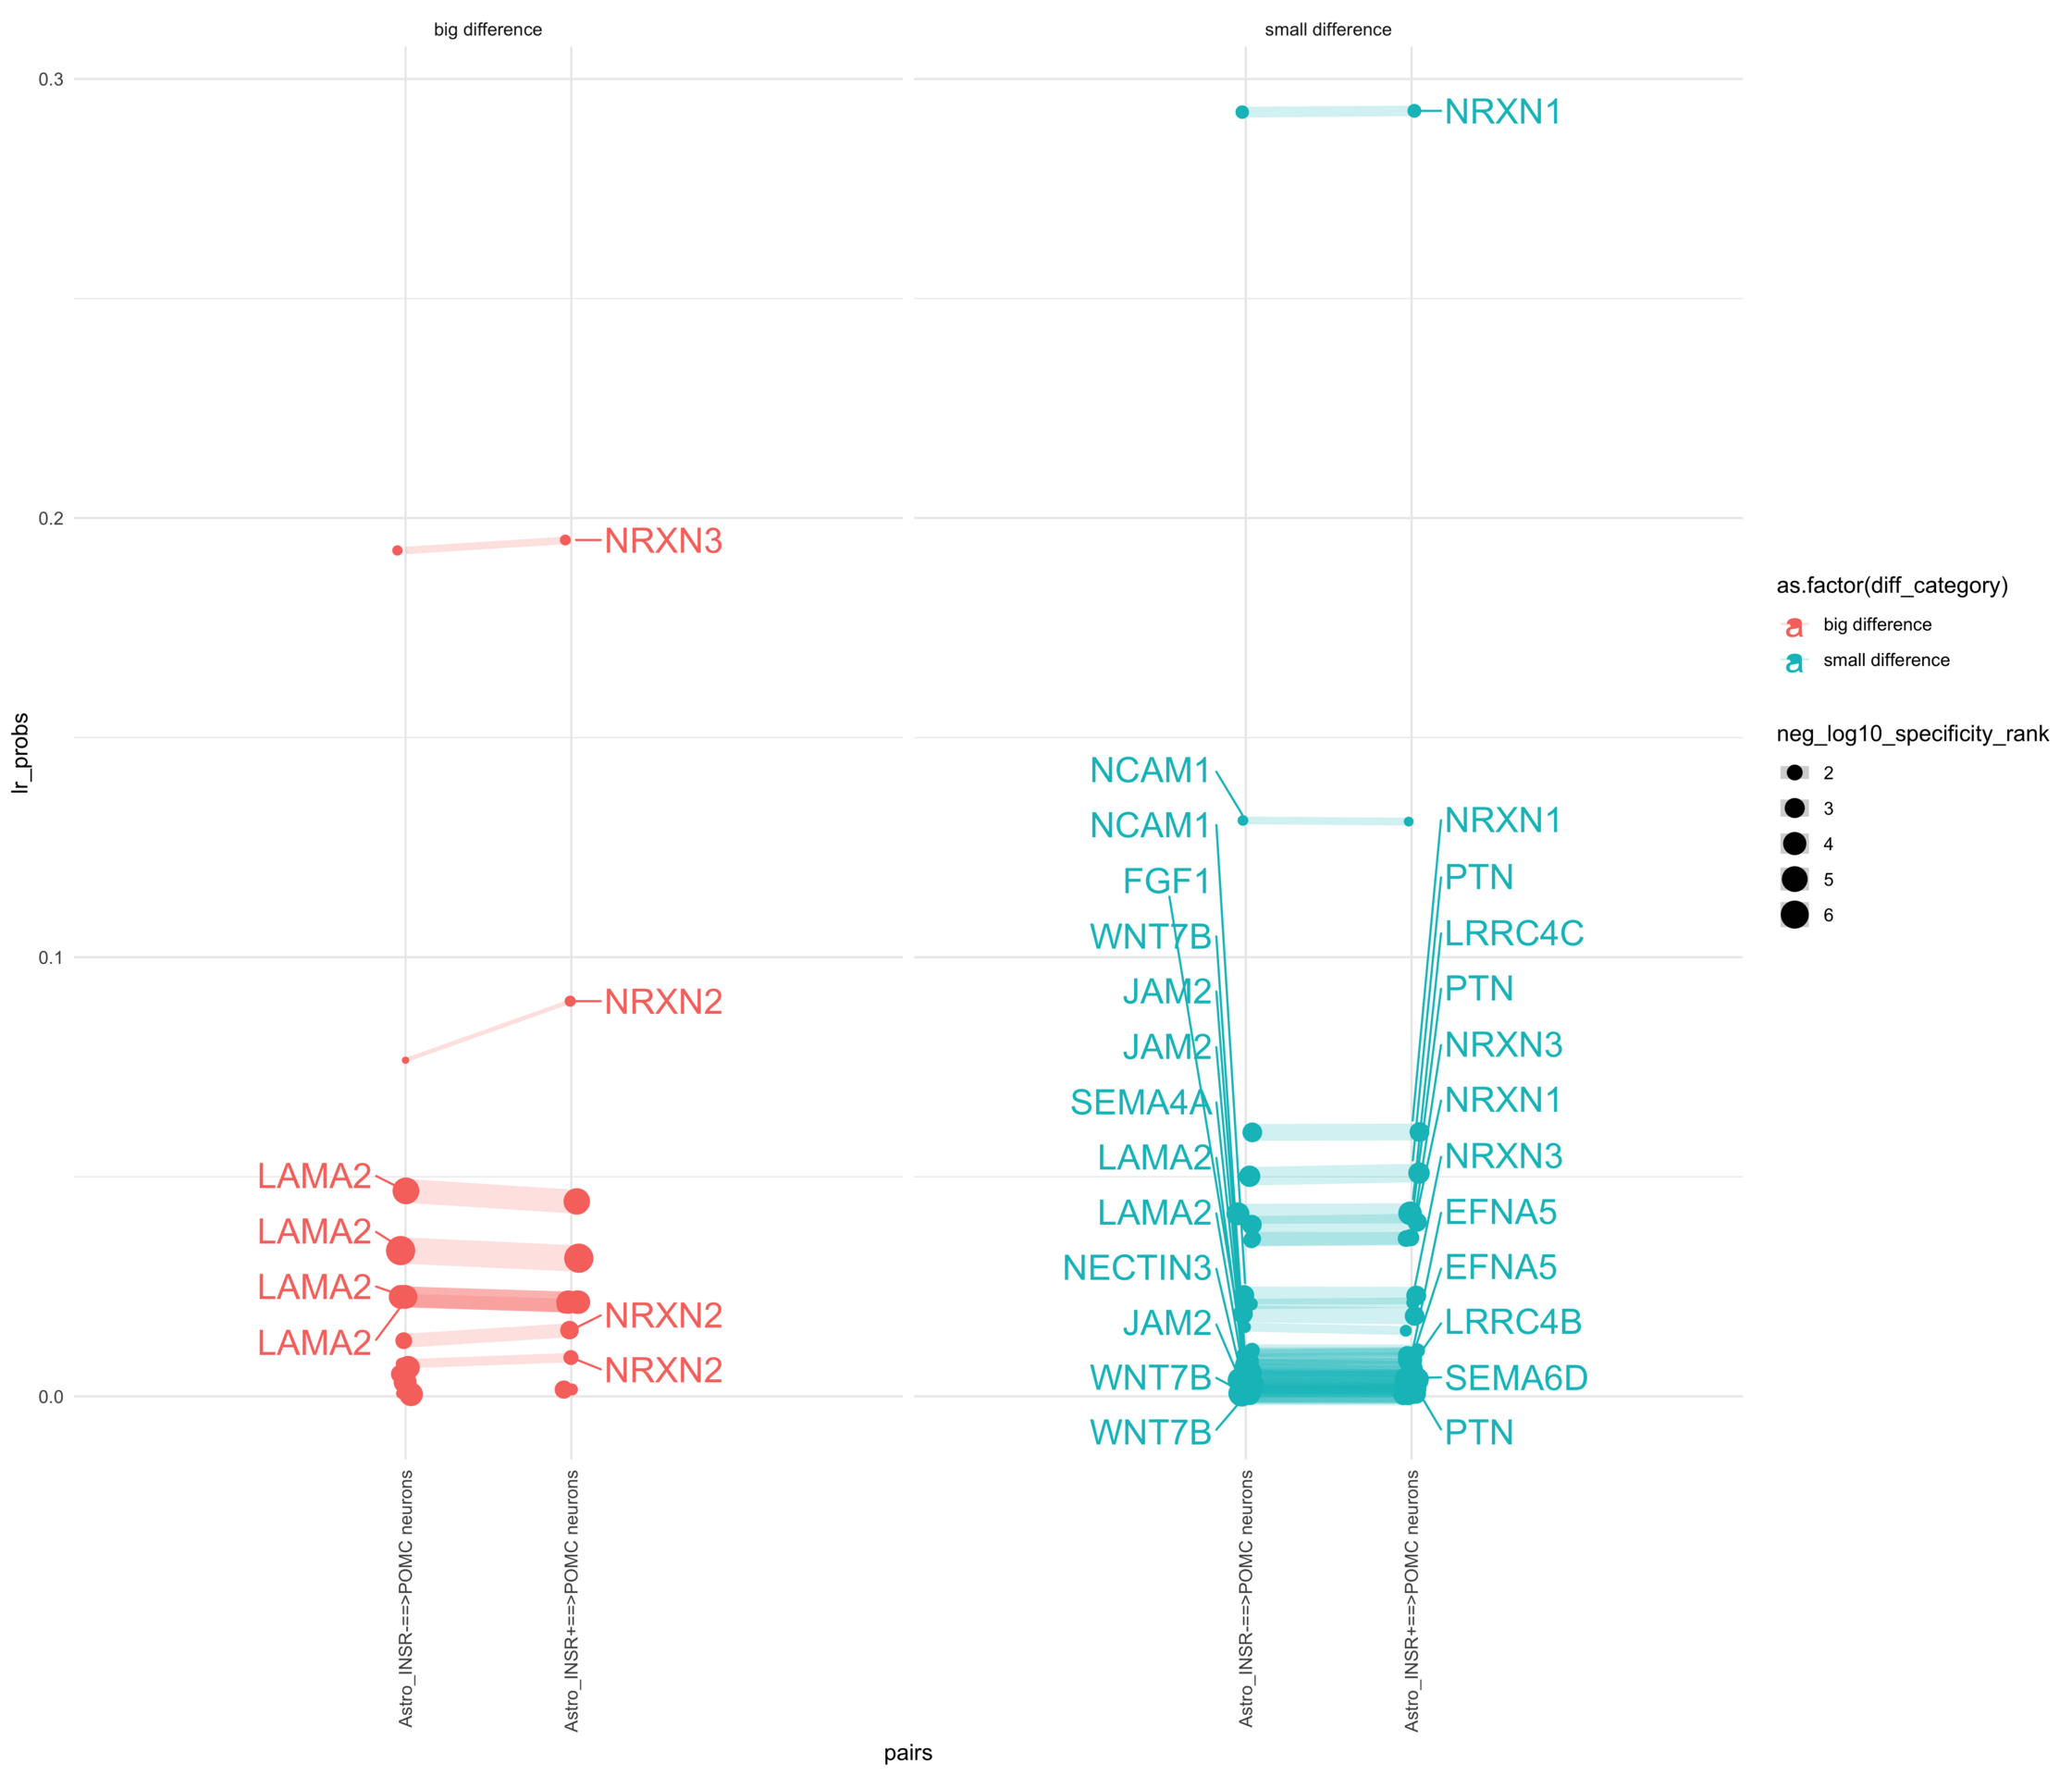
pl <-ggplot(df_long, aes(x = pairs, y = lr_probs, color =as.factor(diff_category), size = neg_log10_specificity_rank)) +geom_jitter(width =0.05) +geom_line(aes(group = lr_complex), linetype ="solid", alpha =0.2) +theme_minimal() +theme(axis.text.x =element_text(angle =90, vjust =0.5, hjust =1)) +facet_wrap(~diff_category)# Add text labels for min and max 5 values within each group using ggrepelpl <- pl +geom_text_repel(data = top_bot_10 %>%filter( pairs =="Astro_INSR+==>POMC neurons", diff_rank >=0 ),aes(label = ligand_complex,point.size = neg_log10_specificity_rank ), # data point sizenudge_x =0.2, direction ="y", hjust ="left",size =6, # font size in the text labelspoint.padding =0.2, # additional padding around each pointmin.segment.length =0, # draw all line segmentsmax.time =5, max.iter =1e6, # stop after 1 second, or after 100,000 iterationsseed = reseed,max.overlaps =Inf,box.padding =0.5) +geom_text_repel(data = top_bot_10 %>%filter( pairs =="Astro_INSR-==>POMC neurons", diff_rank <=0 ),aes(label = ligand_complex,point.size = neg_log10_specificity_rank ), # data point sizenudge_x =-.2, direction ="y", hjust ="right",size =6, # font size in the text labelspoint.padding =0.2, # additional padding around each pointmin.segment.length =0, # draw all line segmentsmax.time =5, max.iter =1e6, # stop after 1 second, or after 100,000 iterationsseed = reseed,max.overlaps =Inf,box.padding =0.5) +scale_x_discrete(expand =expansion(add =2))print(pl)
Code
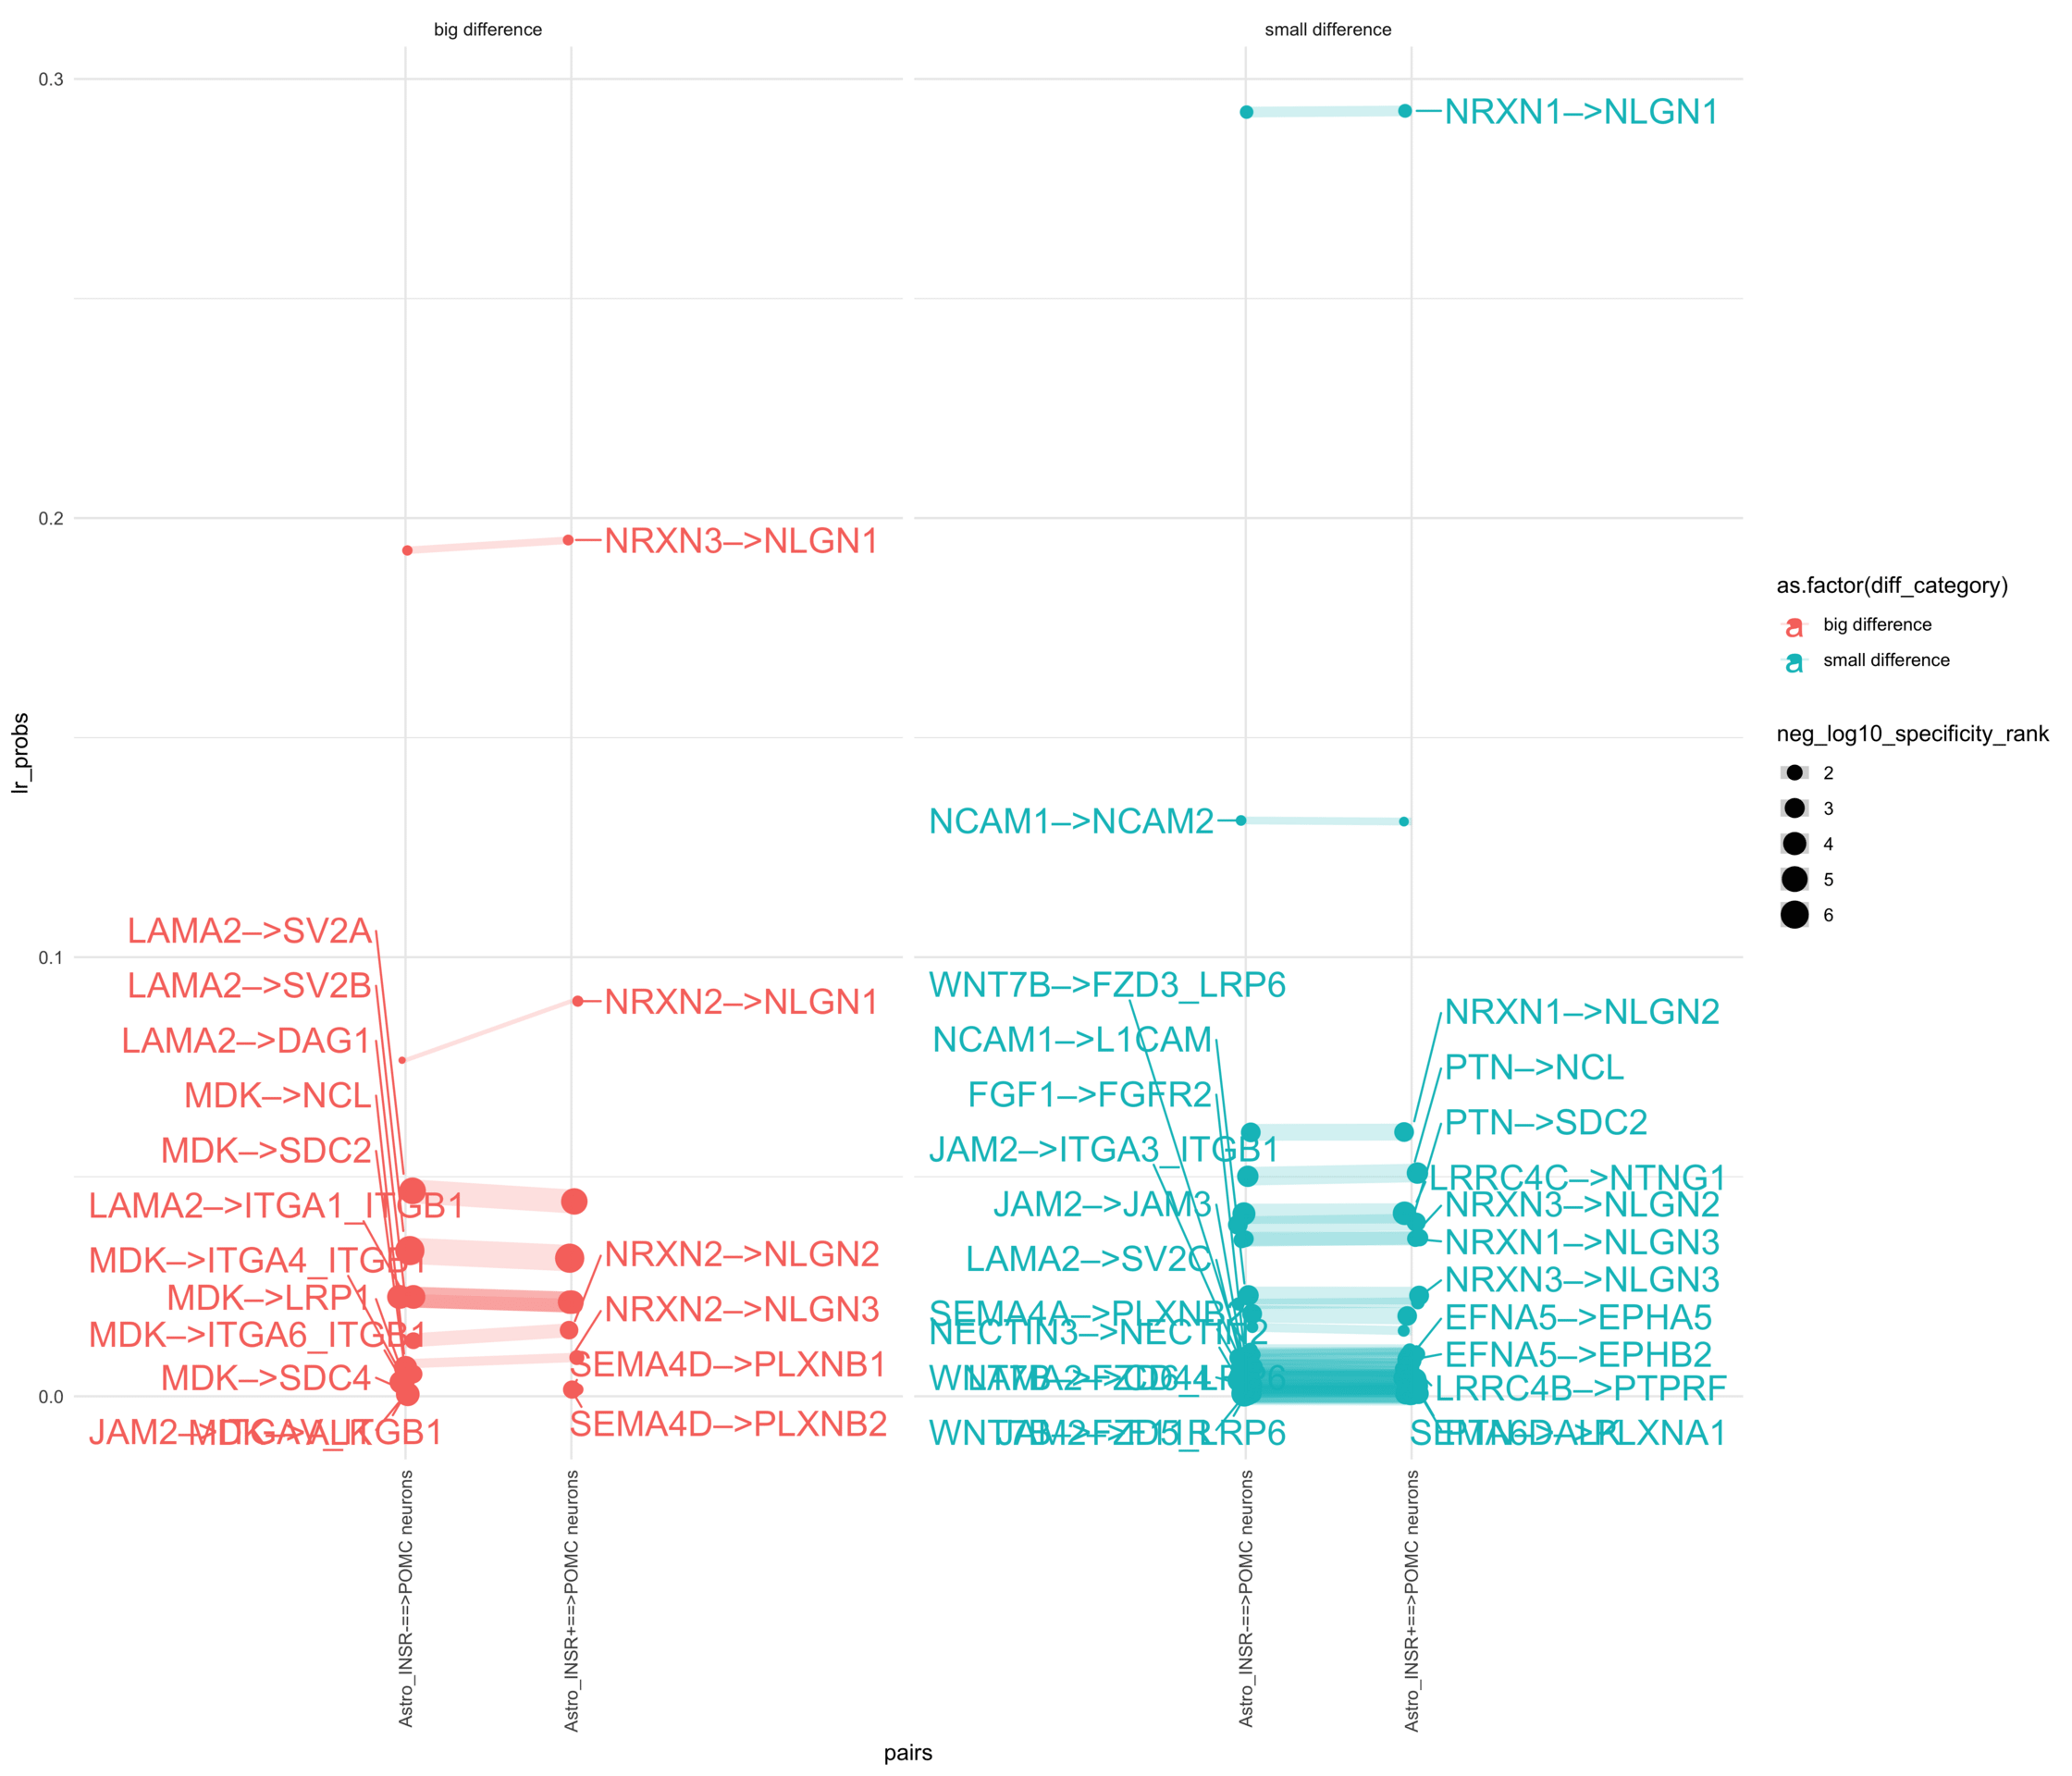
plr <-ggplot(df_long, aes(x = pairs, y = lr_probs, color =as.factor(diff_category), size = neg_log10_specificity_rank)) +geom_jitter(width =0.05) +geom_line(aes(group = lr_complex), linetype ="solid", alpha =0.2) +theme_minimal() +theme(axis.text.x =element_text(angle =90, vjust =0.5, hjust =1)) +facet_wrap(~diff_category)# Add text labels for min and max 5 values within each group using ggrepelplr <- plr +geom_text_repel(data = top_bot_10 %>%filter( (pairs =="Astro_INSR+==>POMC neurons"& diff_rank >=0) | (!is.na(lr_probs) & pairs =="Astro_INSR+==>POMC neurons"&is.na(diff_rank)) ),aes(label = lr_complex,point.size = neg_log10_specificity_rank ), # data point sizenudge_x =0.2, direction ="y", hjust ="left",size =6, # font size in the text labelspoint.padding =0.2, # additional padding around each pointmin.segment.length =0, # draw all line segmentsmax.time =5, max.iter =1e6, # stop after 1 second, or after 100,000 iterationsseed = reseed,max.overlaps =Inf,box.padding =0.5) +geom_text_repel(data = top_bot_10 %>%filter( (pairs =="Astro_INSR-==>POMC neurons"& diff_rank <=0) | (!is.na(lr_probs) & pairs =="Astro_INSR-==>POMC neurons"&is.na(diff_rank)) ),aes(label = lr_complex,point.size = neg_log10_specificity_rank ), # data point sizenudge_x =-.2, direction ="y", hjust ="right",size =6, # font size in the text labelspoint.padding =0.2, # additional padding around each pointmin.segment.length =0, # draw all line segmentsmax.time =5, max.iter =1e6, # stop after 1 second, or after 100,000 iterationsseed = reseed,max.overlaps =Inf,box.padding =0.5) +scale_x_discrete(expand =expansion(add =2))print(plr)
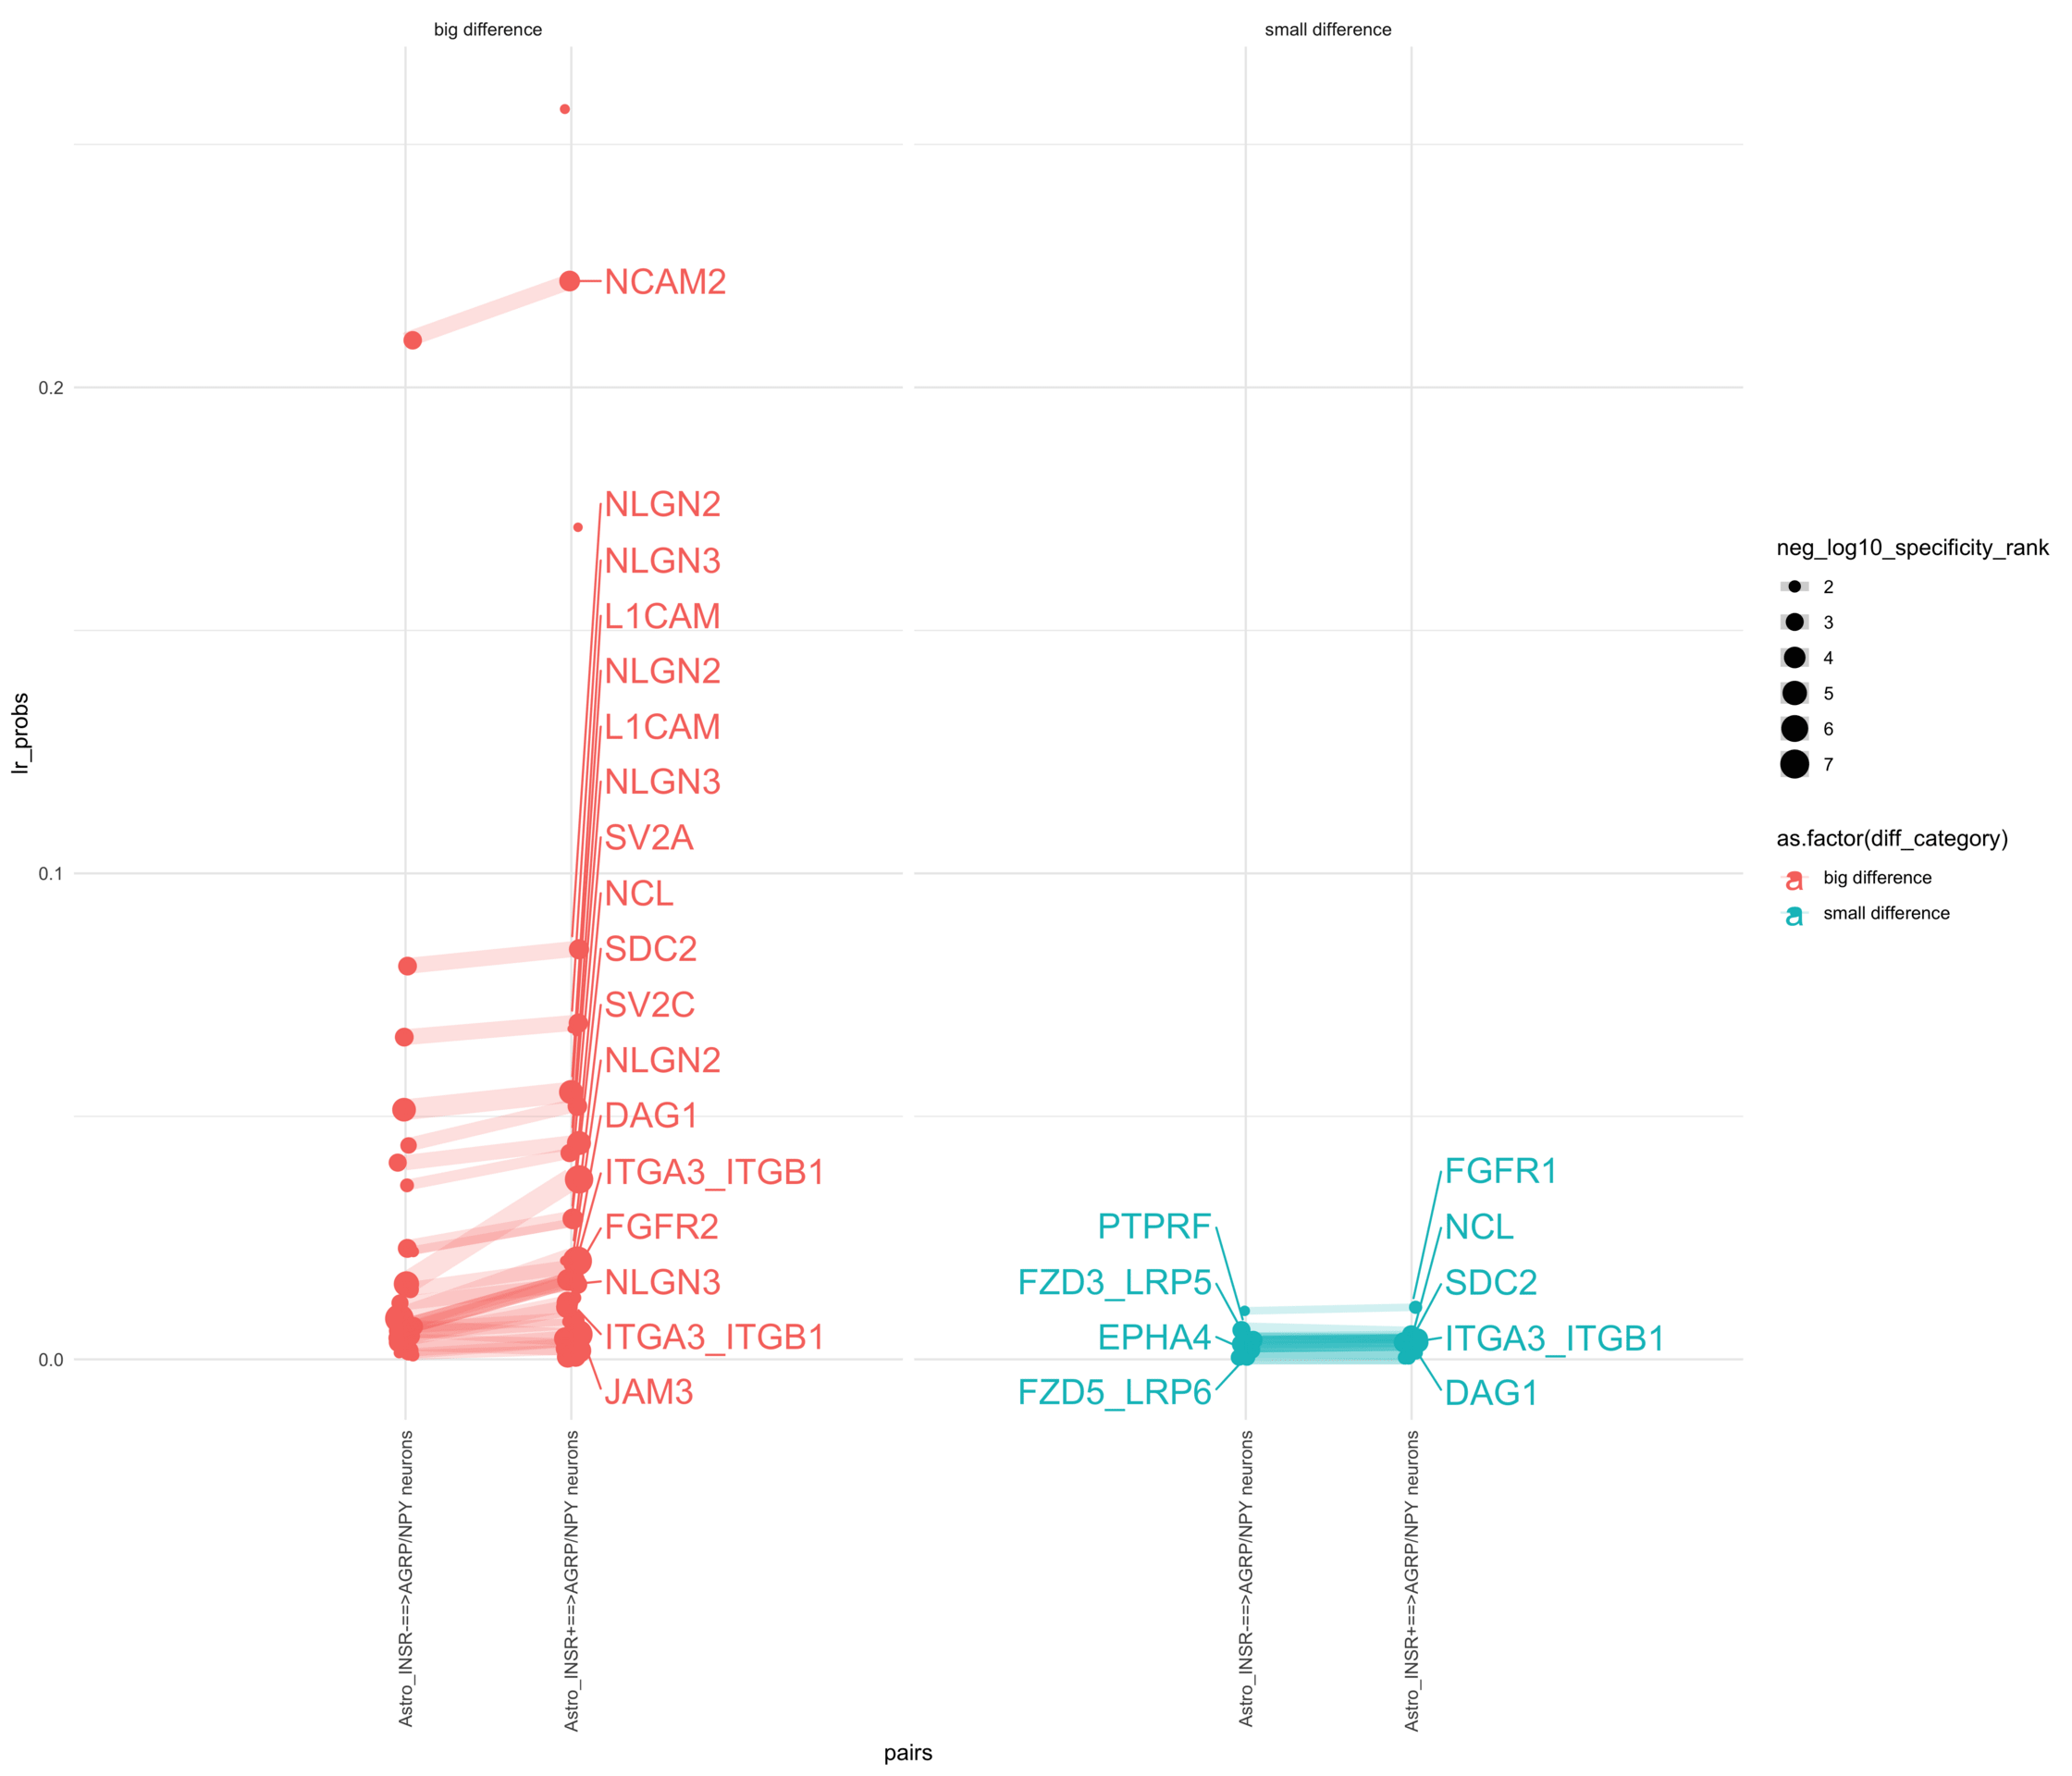
How do insuline receptor positive or negative astrocytes coupled with AGRP/NPY neurons?
# Reshape the dataframe back to a long formatdf_long <- df_wide %>%pivot_longer(cols =c(`Astro_INSR+==>AGRP/NPY neurons`, `Astro_INSR-==>AGRP/NPY neurons`), names_to ="pairs", values_to ="lr_probs") %>%full_join(df_specificity, by =c("pairs", "lr_complex", "ligand_complex", "receptor_complex", "control"))df_long
# Generate the plotpr <-ggplot(df_long, aes(x = pairs, y = lr_probs, color =as.factor(diff_category), size = neg_log10_specificity_rank)) +geom_jitter(width =0.05) +geom_line(aes(group = lr_complex), linetype ="solid", alpha =0.2) +theme_minimal() +theme(axis.text.x =element_text(angle =90, vjust =0.5, hjust =1)) +facet_wrap(~diff_category)# Add text labels for min and max 5 values within each group using ggrepelpr <- pr +geom_text_repel(data = top_bot_10 %>%filter( pairs =="Astro_INSR+==>AGRP/NPY neurons", diff_rank >=0 ),aes(label = receptor_complex,point.size = neg_log10_specificity_rank ), # data point sizenudge_x =0.2, direction ="y", hjust ="left",size =6, # font size in the text labelspoint.padding =0.2, # additional padding around each pointmin.segment.length =0, # draw all line segmentsmax.time =5, max.iter =1e6, # stop after 1 second, or after 100,000 iterationsseed = reseed,max.overlaps =Inf,box.padding =0.5) +geom_text_repel(data = top_bot_10 %>%filter( pairs =="Astro_INSR-==>AGRP/NPY neurons", diff_rank <=0 ),aes(label = receptor_complex,point.size = neg_log10_specificity_rank ), # data point sizenudge_x =-.2, direction ="y", hjust ="right",size =6, # font size in the text labelspoint.padding =0.2, # additional padding around each pointmin.segment.length =0, # draw all line segmentsmax.time =5, max.iter =1e6, # stop after 1 second, or after 100,000 iterationsseed = reseed,max.overlaps =Inf,box.padding =0.5) +scale_x_discrete(expand =expansion(add =2))print(pr)
Code
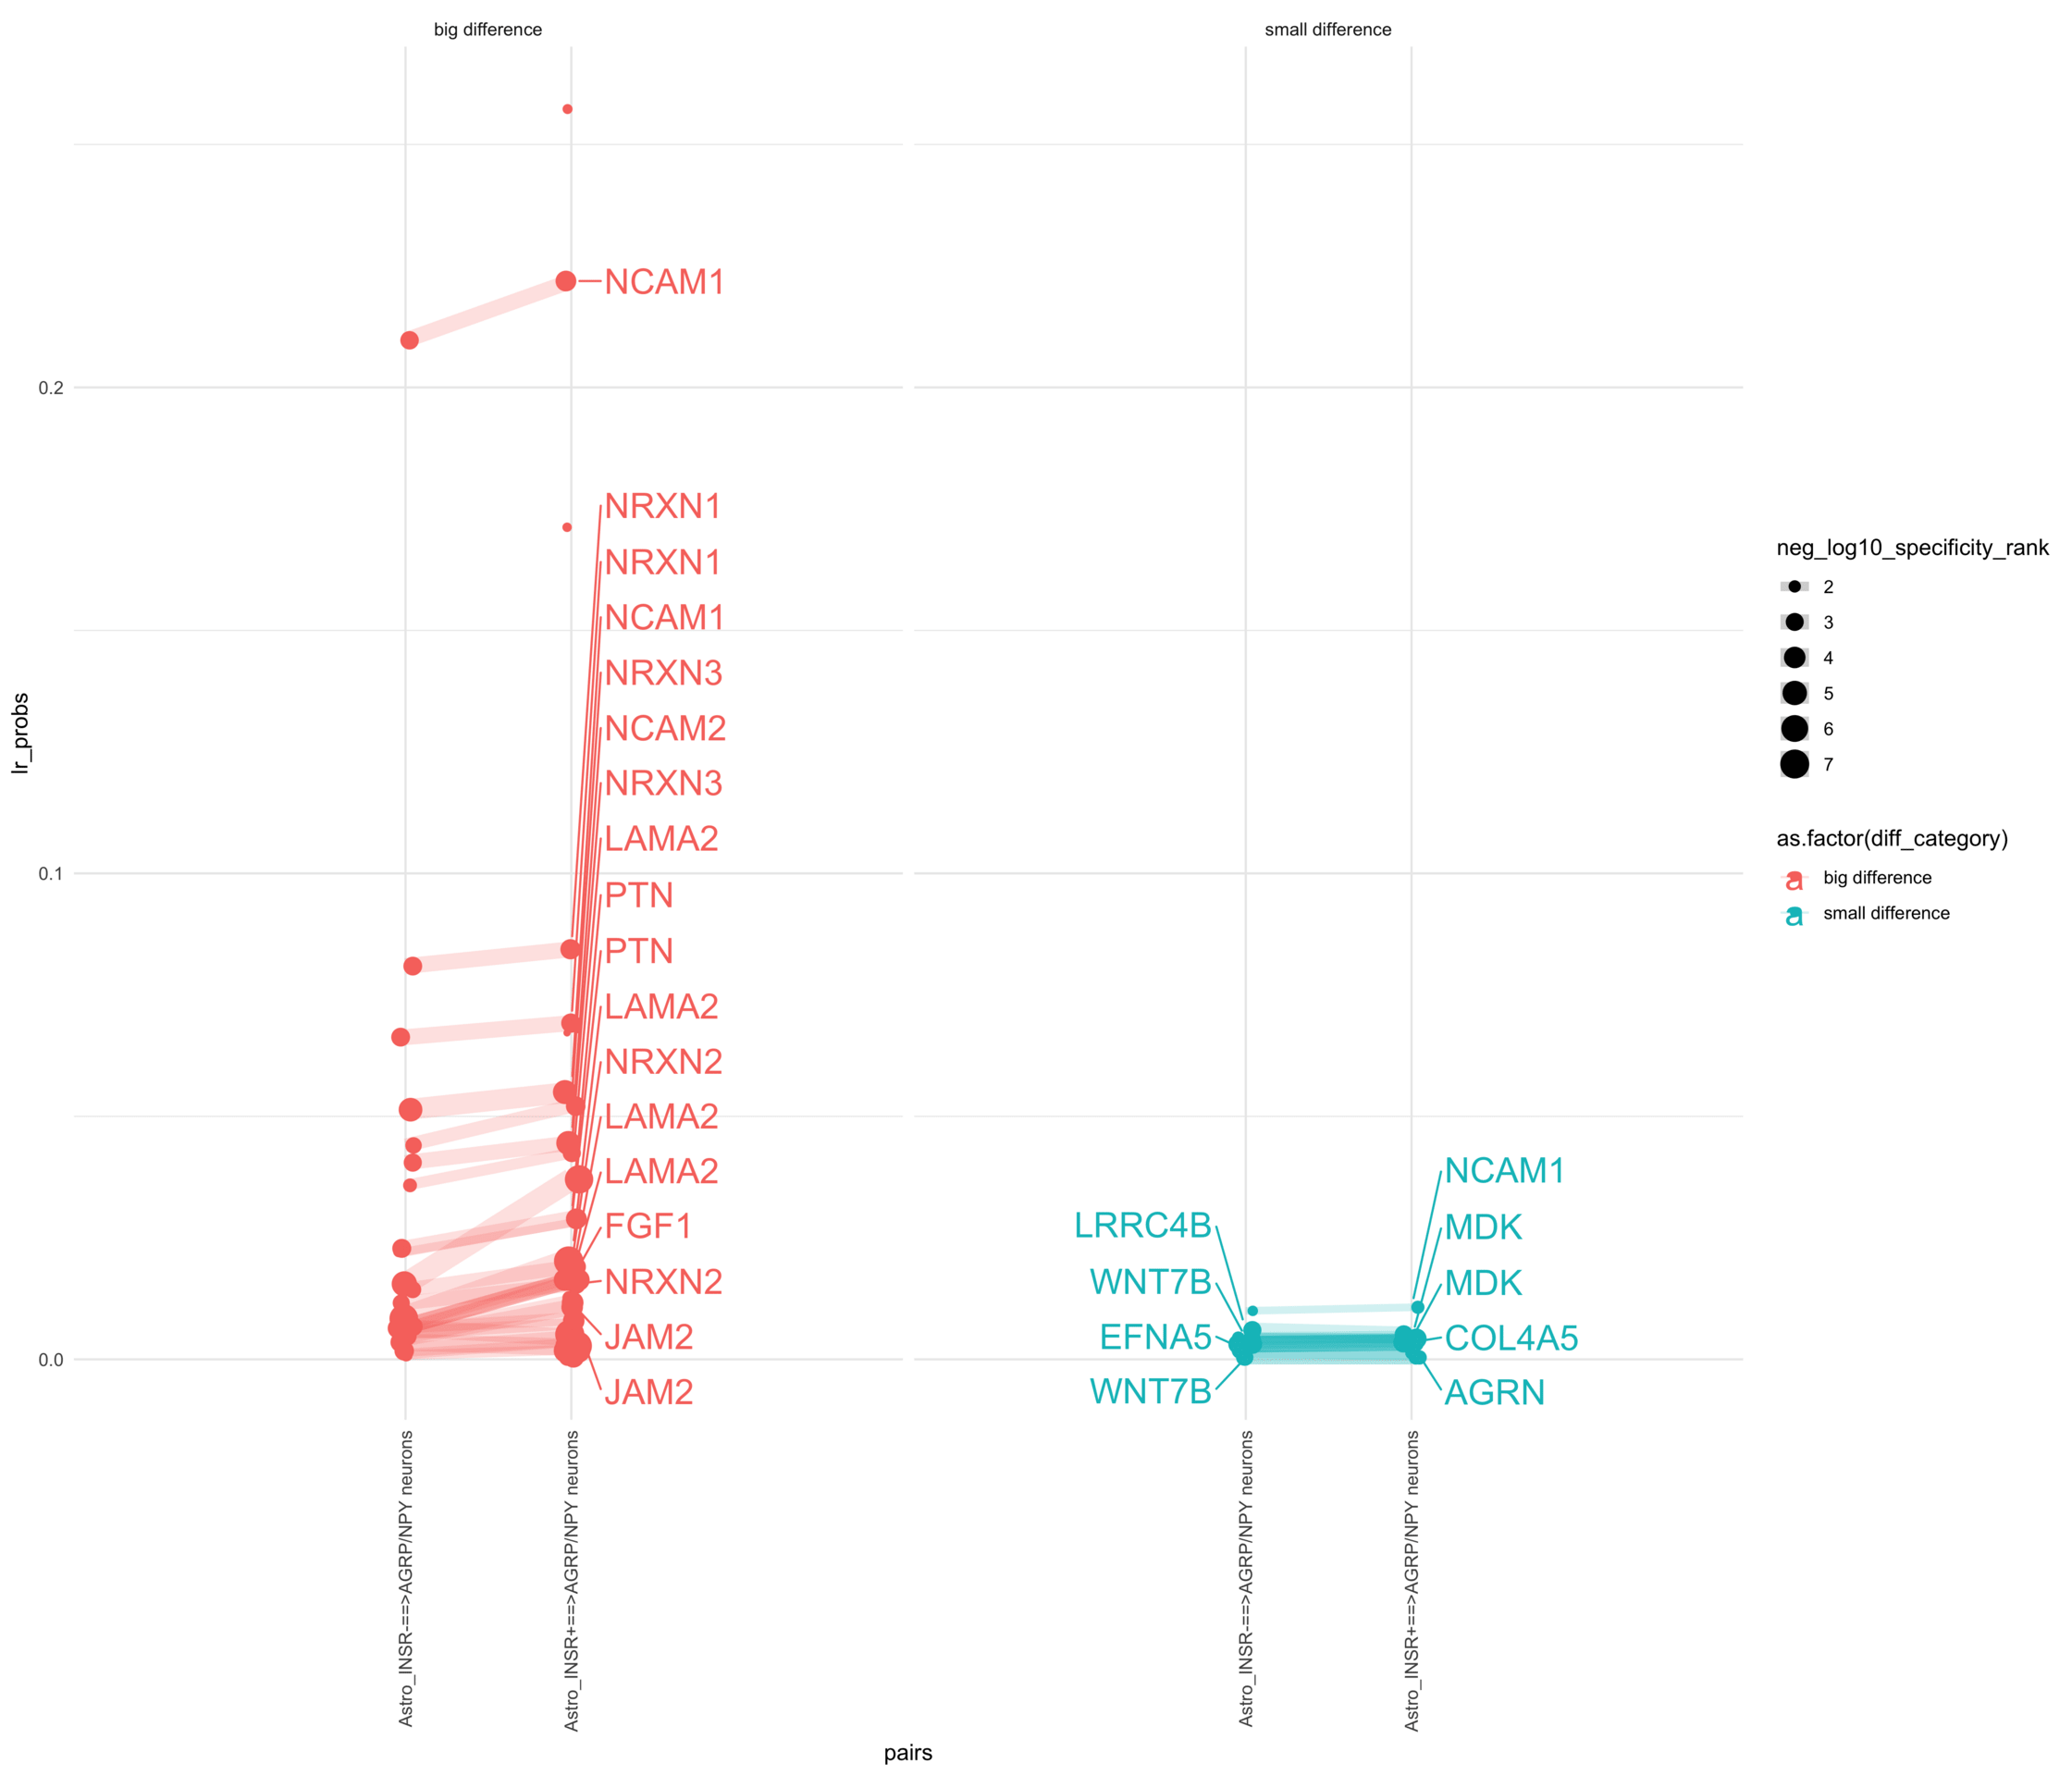
pl <-ggplot(df_long, aes(x = pairs, y = lr_probs, color =as.factor(diff_category), size = neg_log10_specificity_rank)) +geom_jitter(width =0.05) +geom_line(aes(group = lr_complex), linetype ="solid", alpha =0.2) +theme_minimal() +theme(axis.text.x =element_text(angle =90, vjust =0.5, hjust =1)) +facet_wrap(~diff_category)# Add text labels for min and max 5 values within each group using ggrepelpl <- pl +geom_text_repel(data = top_bot_10 %>%filter( pairs =="Astro_INSR+==>AGRP/NPY neurons", diff_rank >=0 ),aes(label = ligand_complex,point.size = neg_log10_specificity_rank ), # data point sizenudge_x =0.2, direction ="y", hjust ="left",size =6, # font size in the text labelspoint.padding =0.2, # additional padding around each pointmin.segment.length =0, # draw all line segmentsmax.time =5, max.iter =1e6, # stop after 1 second, or after 100,000 iterationsseed = reseed,max.overlaps =Inf,box.padding =0.5) +geom_text_repel(data = top_bot_10 %>%filter( pairs =="Astro_INSR-==>AGRP/NPY neurons", diff_rank <=0 ),aes(label = ligand_complex,point.size = neg_log10_specificity_rank ), # data point sizenudge_x =-.2, direction ="y", hjust ="right",size =6, # font size in the text labelspoint.padding =0.2, # additional padding around each pointmin.segment.length =0, # draw all line segmentsmax.time =5, max.iter =1e6, # stop after 1 second, or after 100,000 iterationsseed = reseed,max.overlaps =Inf,box.padding =0.5) +scale_x_discrete(expand =expansion(add =2))print(pl)
Code
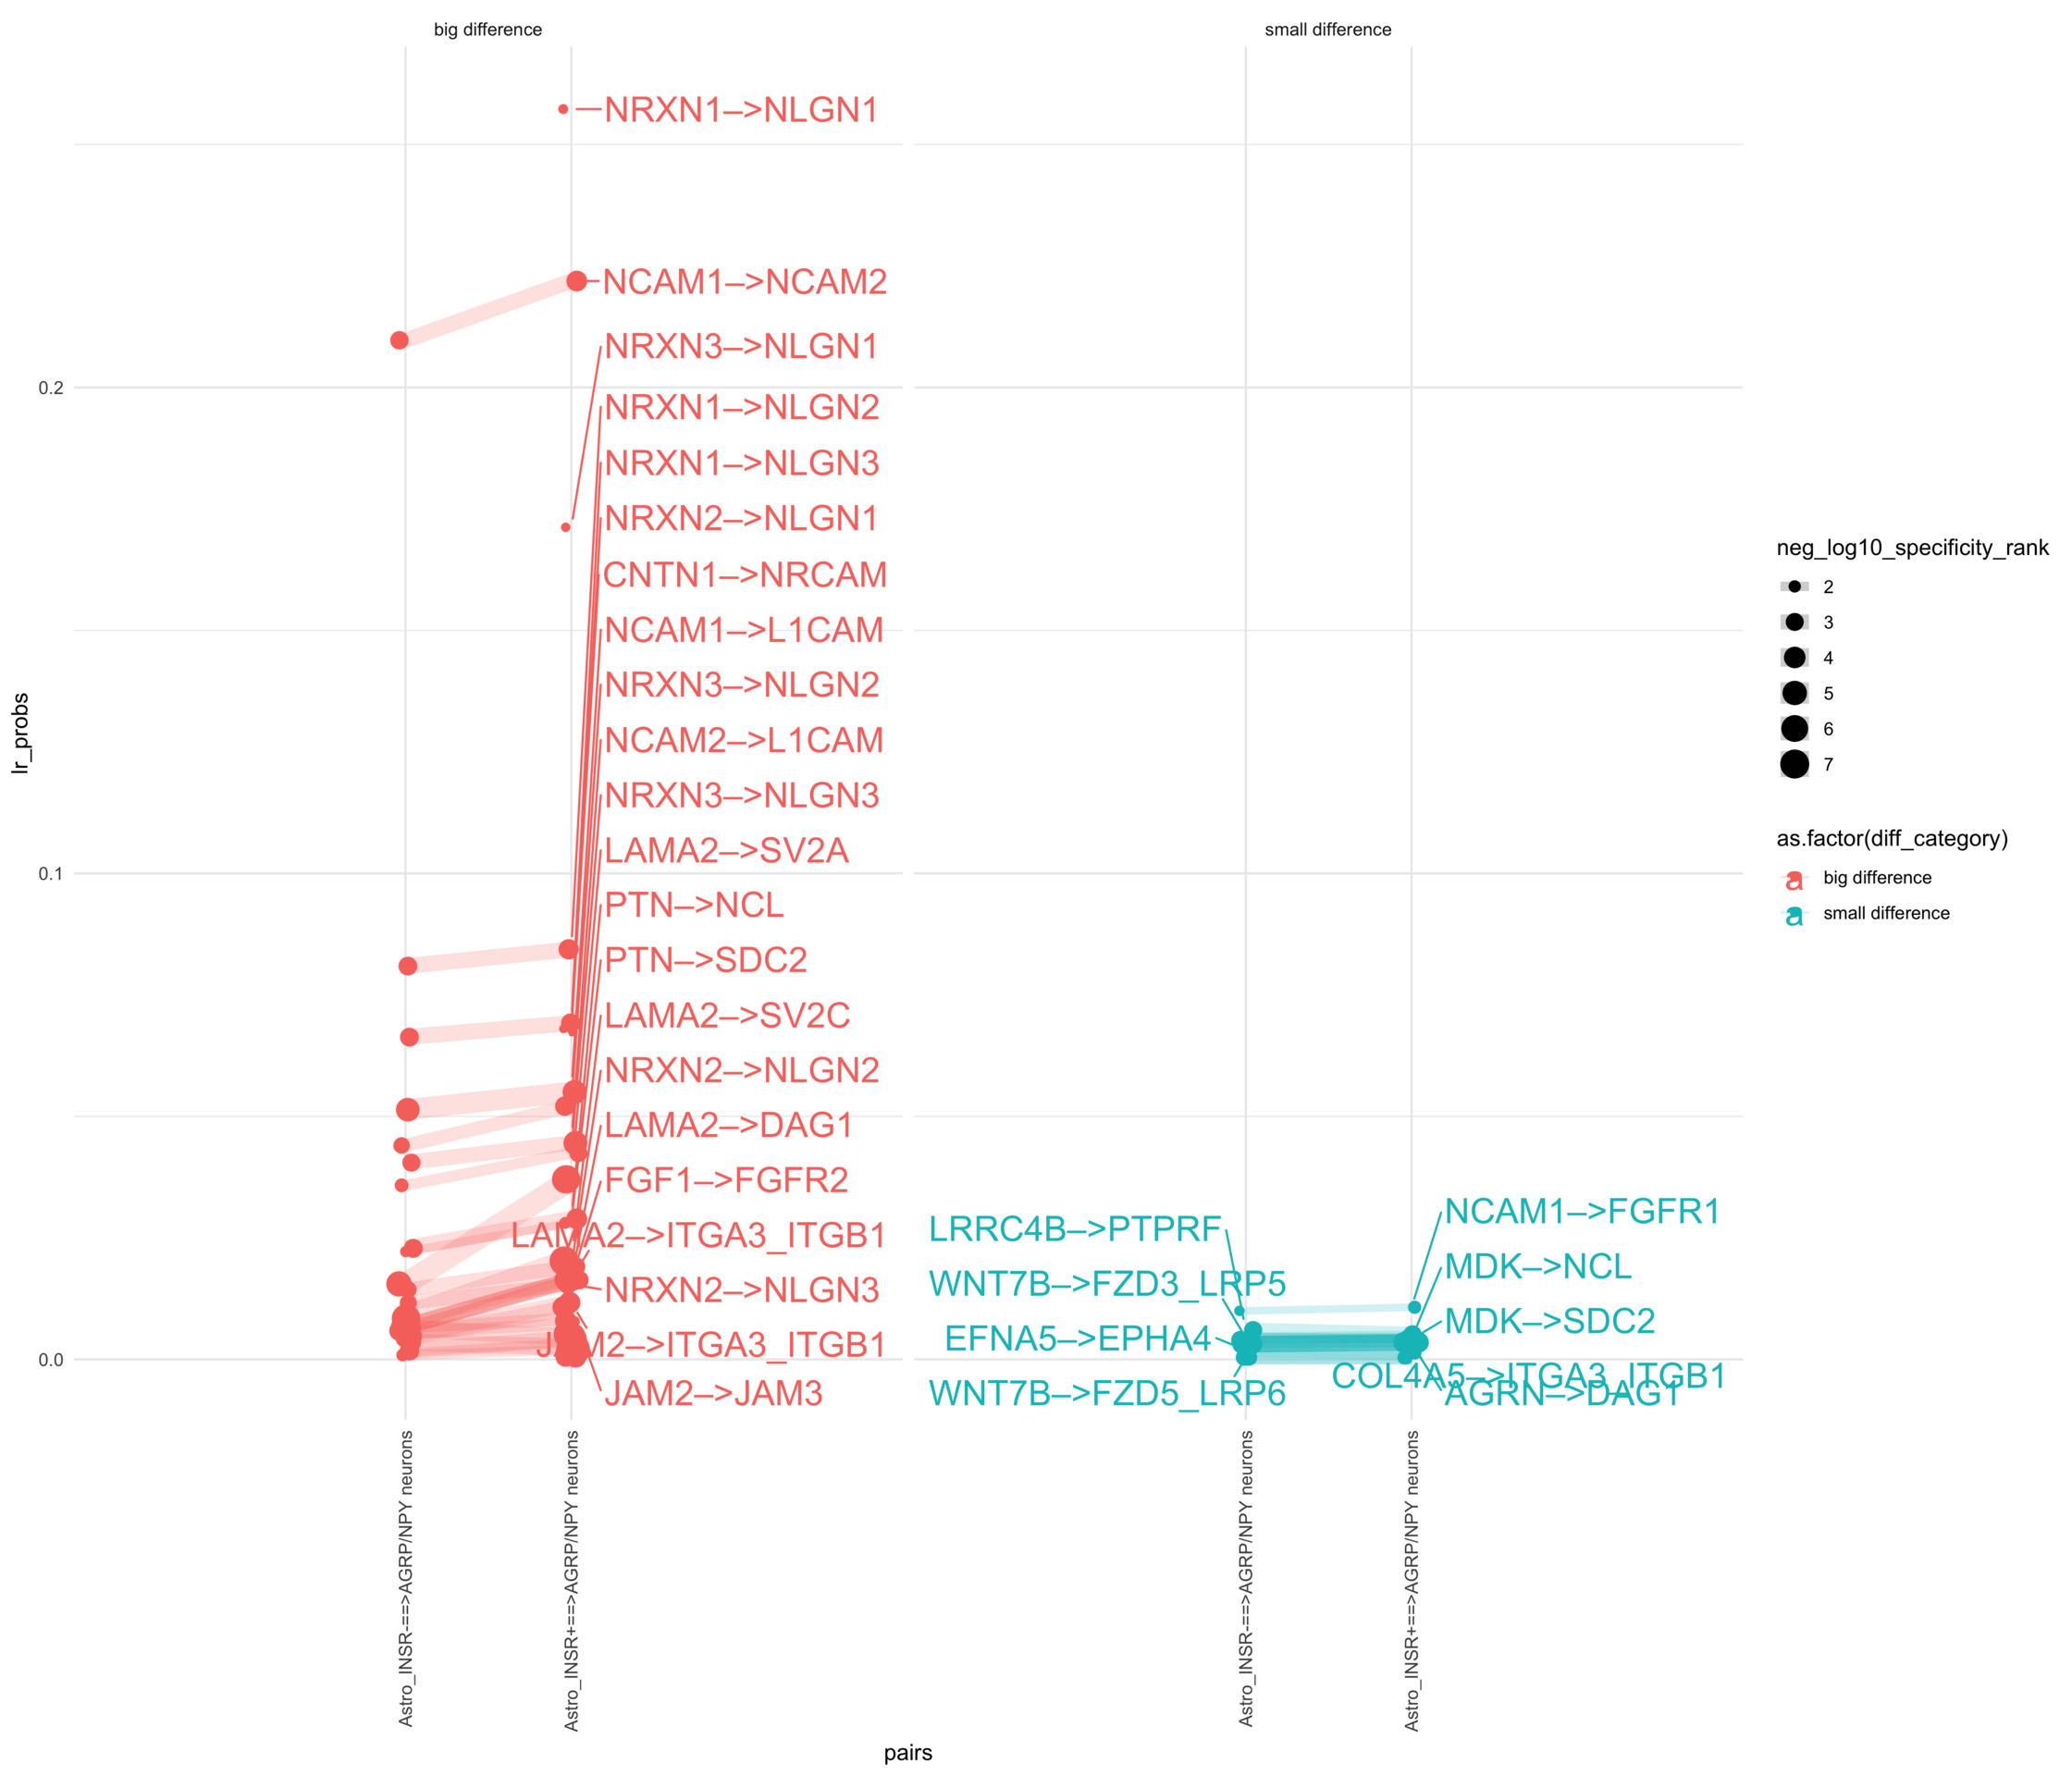
plr <-ggplot(df_long, aes(x = pairs, y = lr_probs, color =as.factor(diff_category), size = neg_log10_specificity_rank)) +geom_jitter(width =0.05) +geom_line(aes(group = lr_complex), linetype ="solid", alpha =0.2) +theme_minimal() +theme(axis.text.x =element_text(angle =90, vjust =0.5, hjust =1)) +facet_wrap(~diff_category)# Add text labels for min and max 5 values within each group using ggrepelplr <- plr +geom_text_repel(data = top_bot_10 %>%filter( (pairs =="Astro_INSR+==>AGRP/NPY neurons"& diff_rank >=0) | (!is.na(lr_probs) & pairs =="Astro_INSR+==>AGRP/NPY neurons"&is.na(diff_rank)) ),aes(label = lr_complex,point.size = neg_log10_specificity_rank ), # data point sizenudge_x =0.2, direction ="y", hjust ="left",size =6, # font size in the text labelspoint.padding =0.2, # additional padding around each pointmin.segment.length =0, # draw all line segmentsmax.time =5, max.iter =1e6, # stop after 1 second, or after 100,000 iterationsseed = reseed,max.overlaps =Inf,box.padding =0.5) +geom_text_repel(data = top_bot_10 %>%filter( (pairs =="Astro_INSR-==>AGRP/NPY neurons"& diff_rank <=0) | (!is.na(lr_probs) & pairs =="Astro_INSR-==>AGRP/NPY neurons"&is.na(diff_rank)) ),aes(label = lr_complex,point.size = neg_log10_specificity_rank ), # data point sizenudge_x =-.2, direction ="y", hjust ="right",size =6, # font size in the text labelspoint.padding =0.2, # additional padding around each pointmin.segment.length =0, # draw all line segmentsmax.time =5, max.iter =1e6, # stop after 1 second, or after 100,000 iterationsseed = reseed,max.overlaps =Inf,box.padding =0.5) +scale_x_discrete(expand =expansion(add =2))print(plr)