Load selected astrocytes signalling data estimated using Liana-py and Rank Aggregation method (including CellPhoneDB, CellChat, ICELLNET, connectomeDB2020, and CellTalkDB)
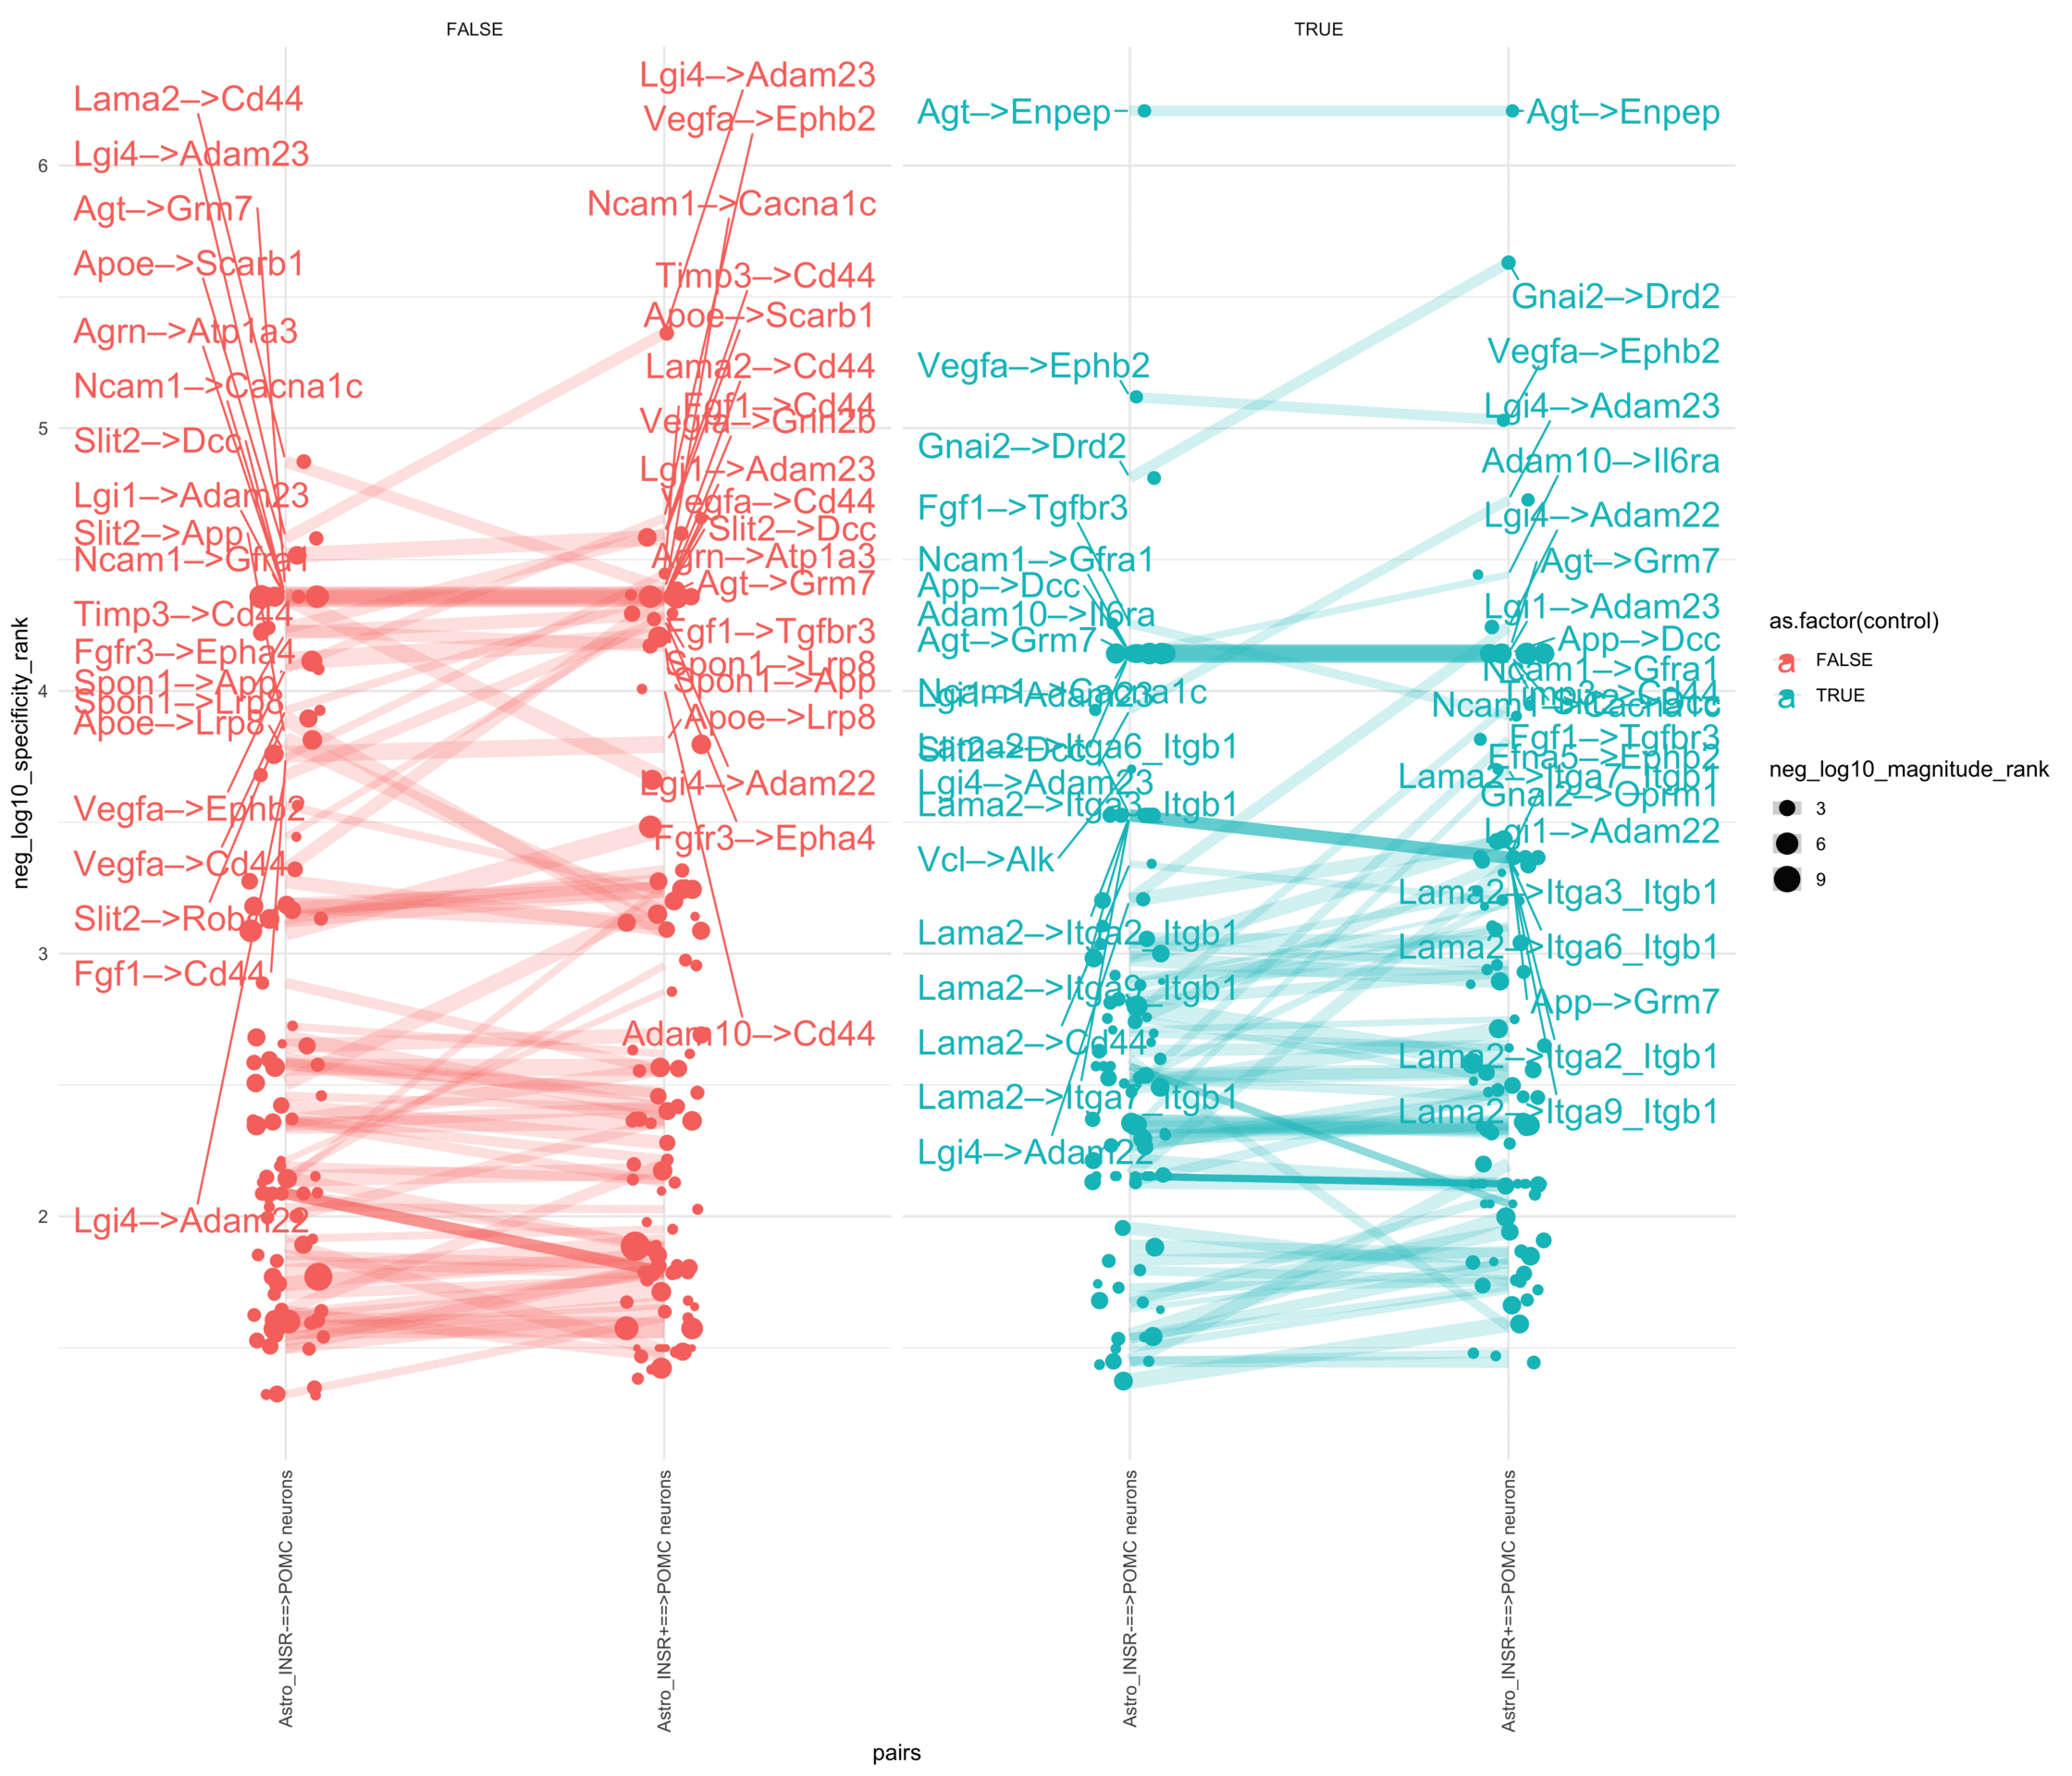
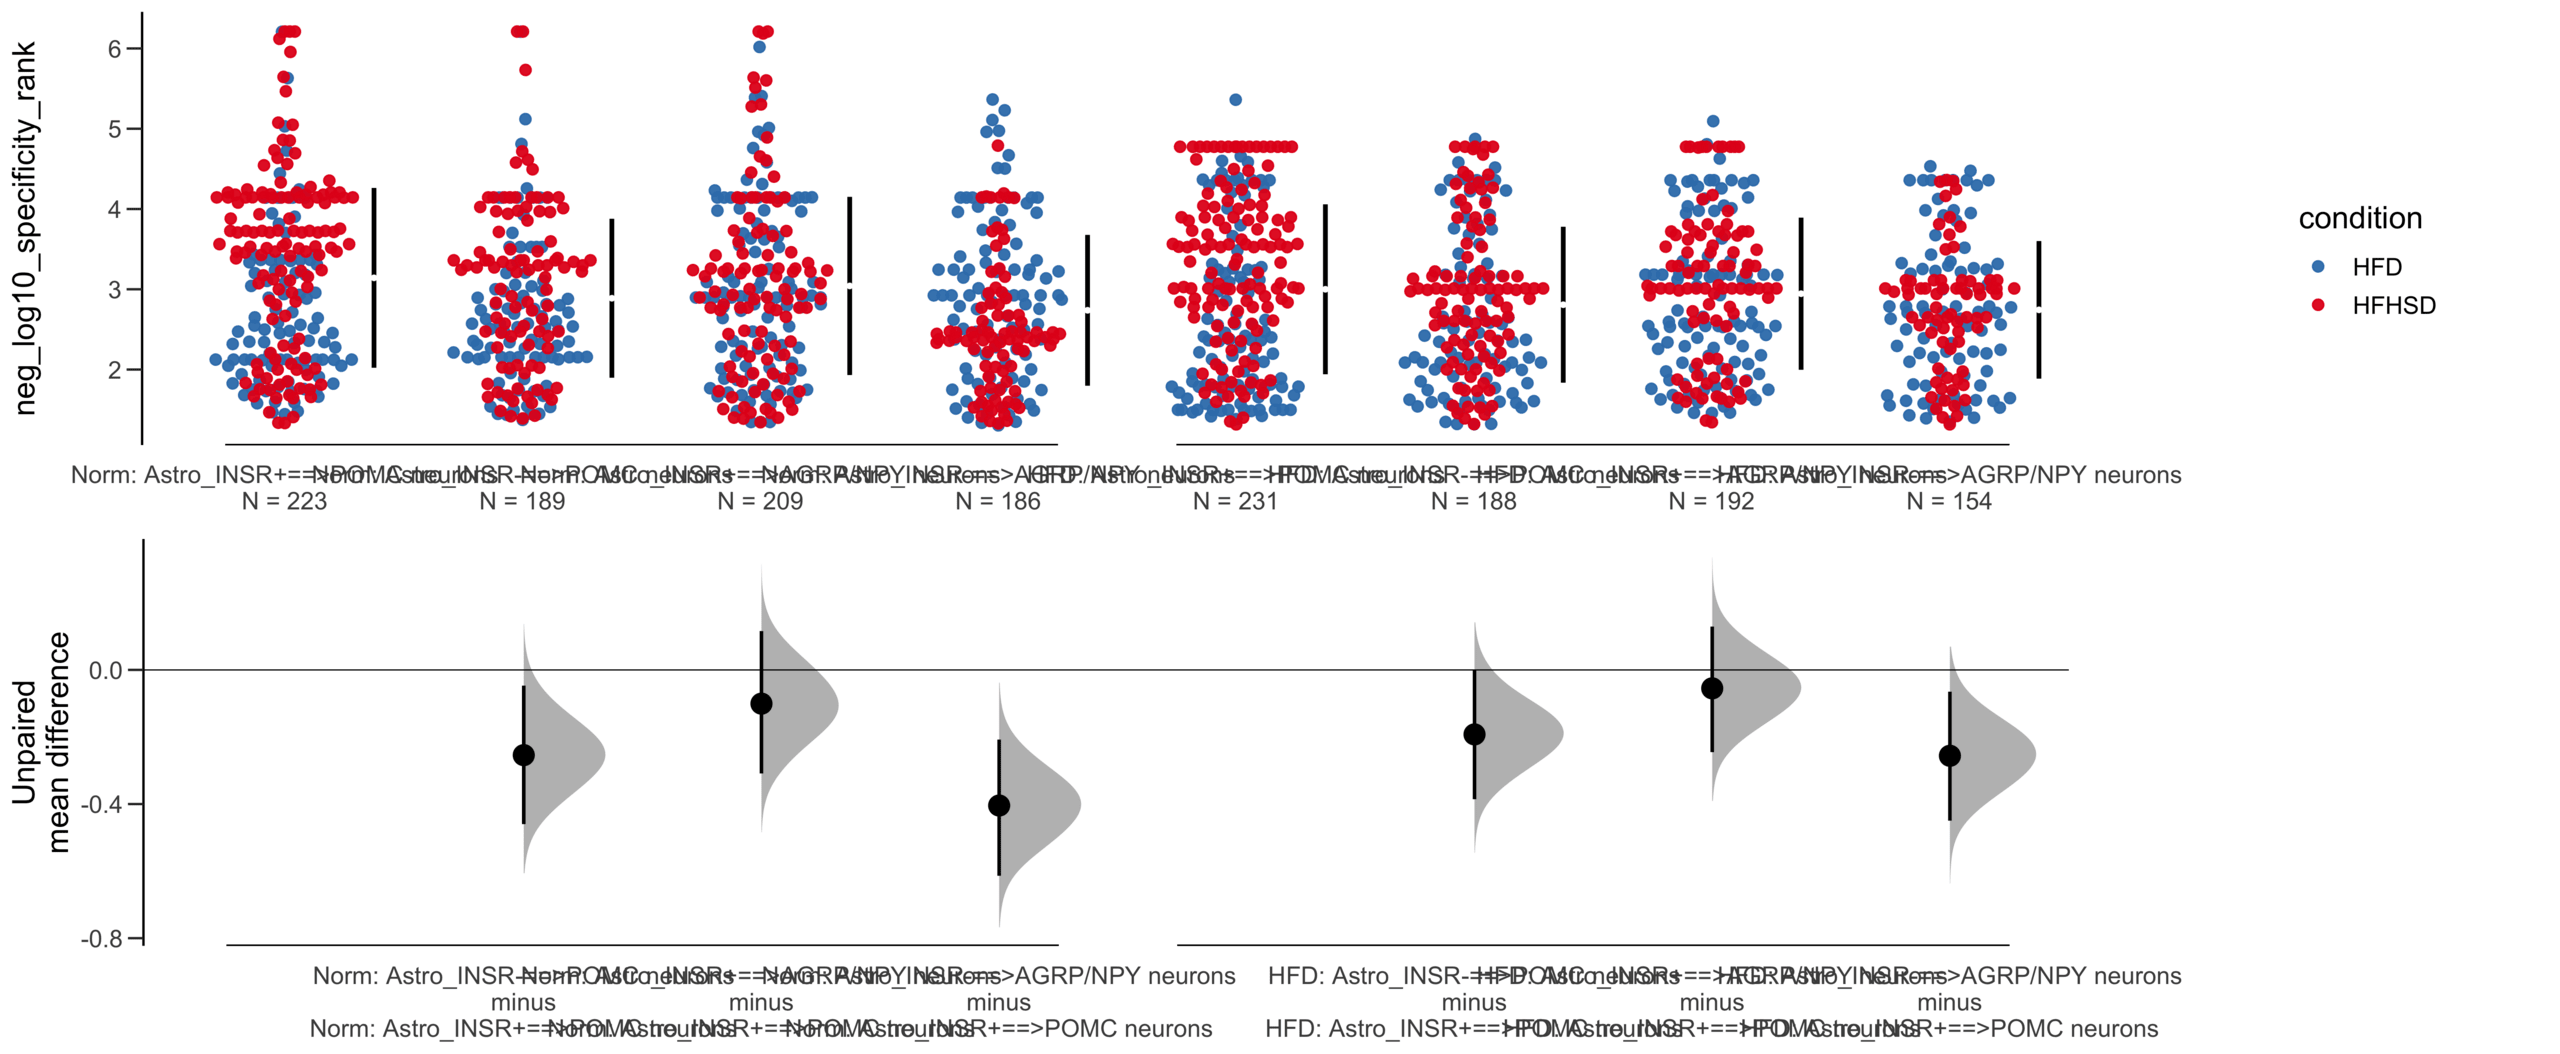
pr <-ggplot(df, aes(x = pairs, y = neg_log10_specificity_rank, color =as.factor(control), size = neg_log10_magnitude_rank)) +geom_jitter(width =0.1) +geom_line(aes(group = lr_complex), linetype ="solid", alpha =0.2) +theme_minimal() +theme(axis.text.x =element_text(angle =90, vjust =0.5, hjust =1)) +facet_wrap(~control)# Add text labels for min and max 5 values within each group using ggrepelpr <- pr +geom_text_repel(data = top_bot_10 %>%filter(pairs =="Astro_INSR+==>POMC neurons"),aes(label = receptor_complex,point.size = neg_log10_magnitude_rank ), # data point sizenudge_x =0.2, direction ="y", hjust ="left",size =6, # font size in the text labelspoint.padding =0, # additional padding around each pointmin.segment.length =0, # draw all line segmentsmax.time =5, max.iter =1e6, # stop after 1 second, or after 100,000 iterationsseed = reseed,max.overlaps =Inf,box.padding =0.5) +geom_text_repel(data = top_bot_10 %>%filter(pairs =="Astro_INSR-==>POMC neurons"),aes(label = receptor_complex,point.size = neg_log10_magnitude_rank ), # data point sizenudge_x =-.2, direction ="y", hjust ="right",size =6, # font size in the text labelspoint.padding =0, # additional padding around each pointmin.segment.length =0, # draw all line segmentsmax.time =5, max.iter =1e6, # stop after 1 second, or after 100,000 iterationsseed = reseed,max.overlaps =Inf,box.padding =0.5)print(pr)
Code
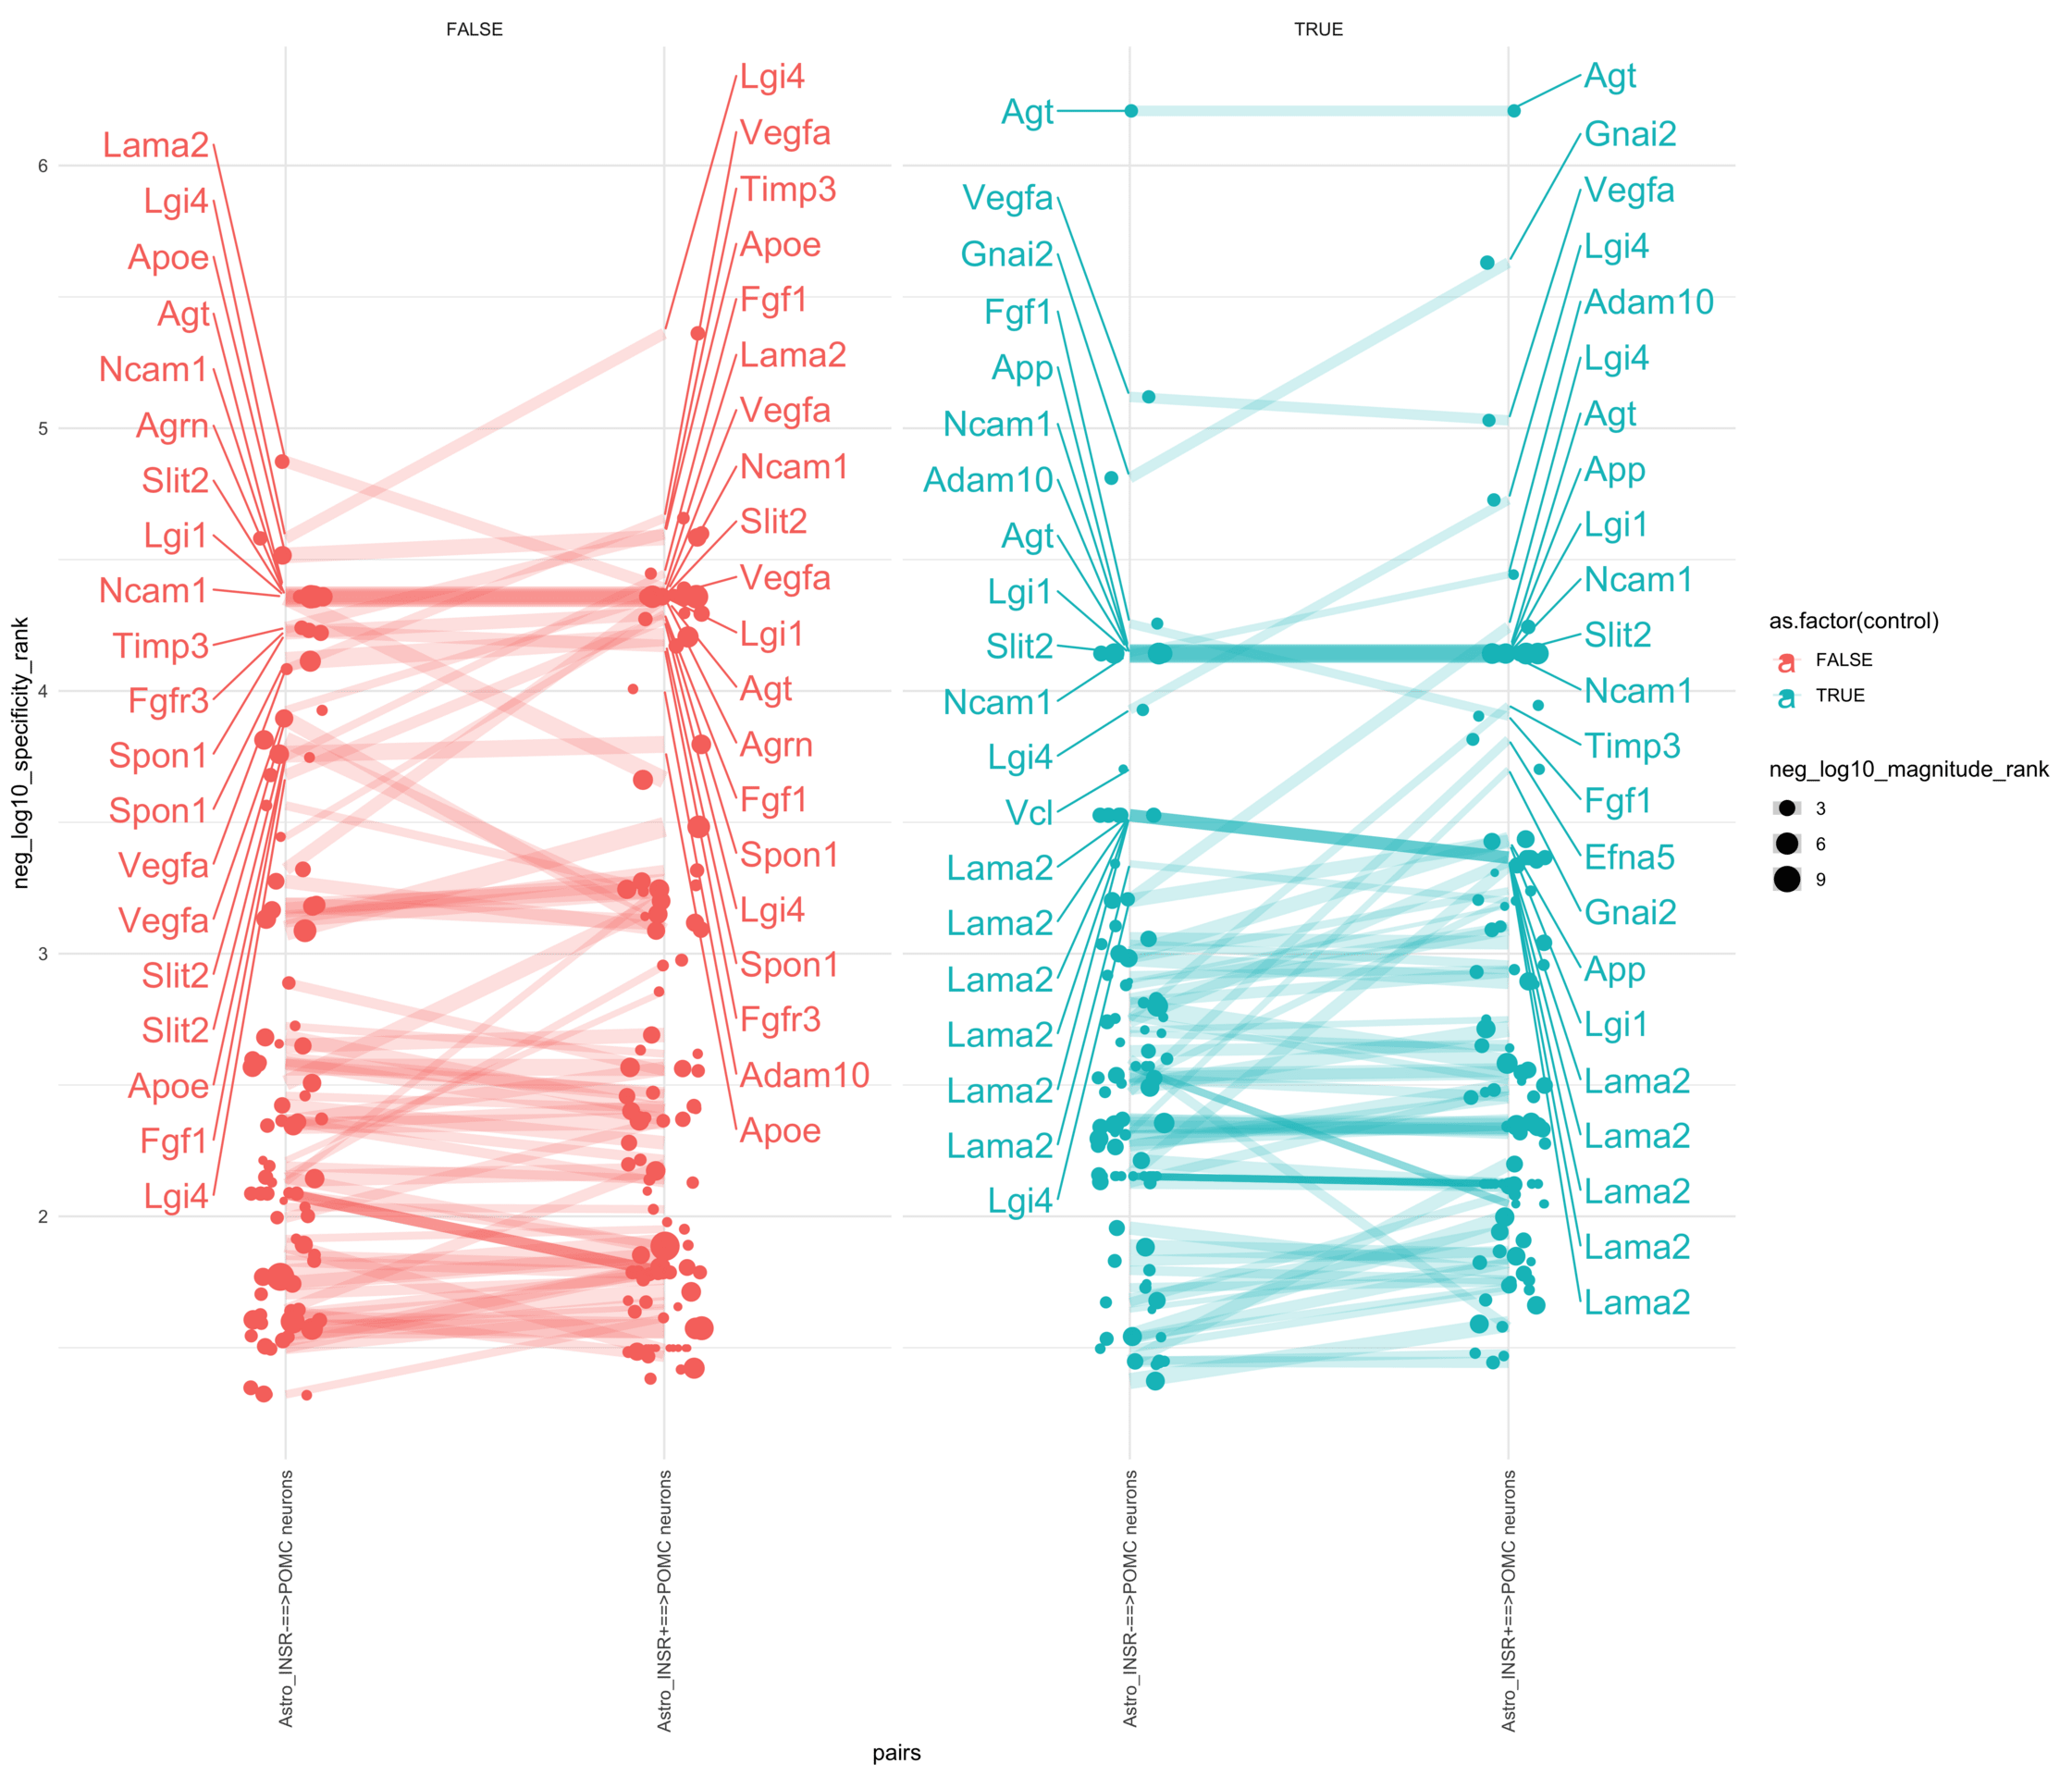
pl <-ggplot(df, aes(x = pairs, y = neg_log10_specificity_rank, color =as.factor(control), size = neg_log10_magnitude_rank)) +geom_jitter(width =0.1) +geom_line(aes(group = lr_complex), linetype ="solid", alpha =0.2) +theme_minimal() +theme(axis.text.x =element_text(angle =90, vjust =0.5, hjust =1)) +facet_wrap(~control)# Add text labels for min and max 5 values within each group using ggrepelpl <- pl +geom_text_repel(data = top_bot_10 %>%filter(pairs =="Astro_INSR+==>POMC neurons"),aes(label = ligand_complex,point.size = neg_log10_magnitude_rank ), # data point sizenudge_x =0.2, direction ="y", hjust ="left",size =6, # font size in the text labelspoint.padding =0, # additional padding around each pointmin.segment.length =0, # draw all line segmentsmax.time =5, max.iter =1e6, # stop after 1 second, or after 100,000 iterationsseed = reseed,max.overlaps =Inf,box.padding =0.5) +geom_text_repel(data = top_bot_10 %>%filter(pairs =="Astro_INSR-==>POMC neurons"),aes(label = ligand_complex,point.size = neg_log10_magnitude_rank ), # data point sizenudge_x =-.2, direction ="y", hjust ="right",size =6, # font size in the text labelspoint.padding =0, # additional padding around each pointmin.segment.length =0, # draw all line segmentsmax.time =5, max.iter =1e6, # stop after 1 second, or after 100,000 iterationsseed = reseed,max.overlaps =Inf,box.padding =0.5)print(pl)
Code
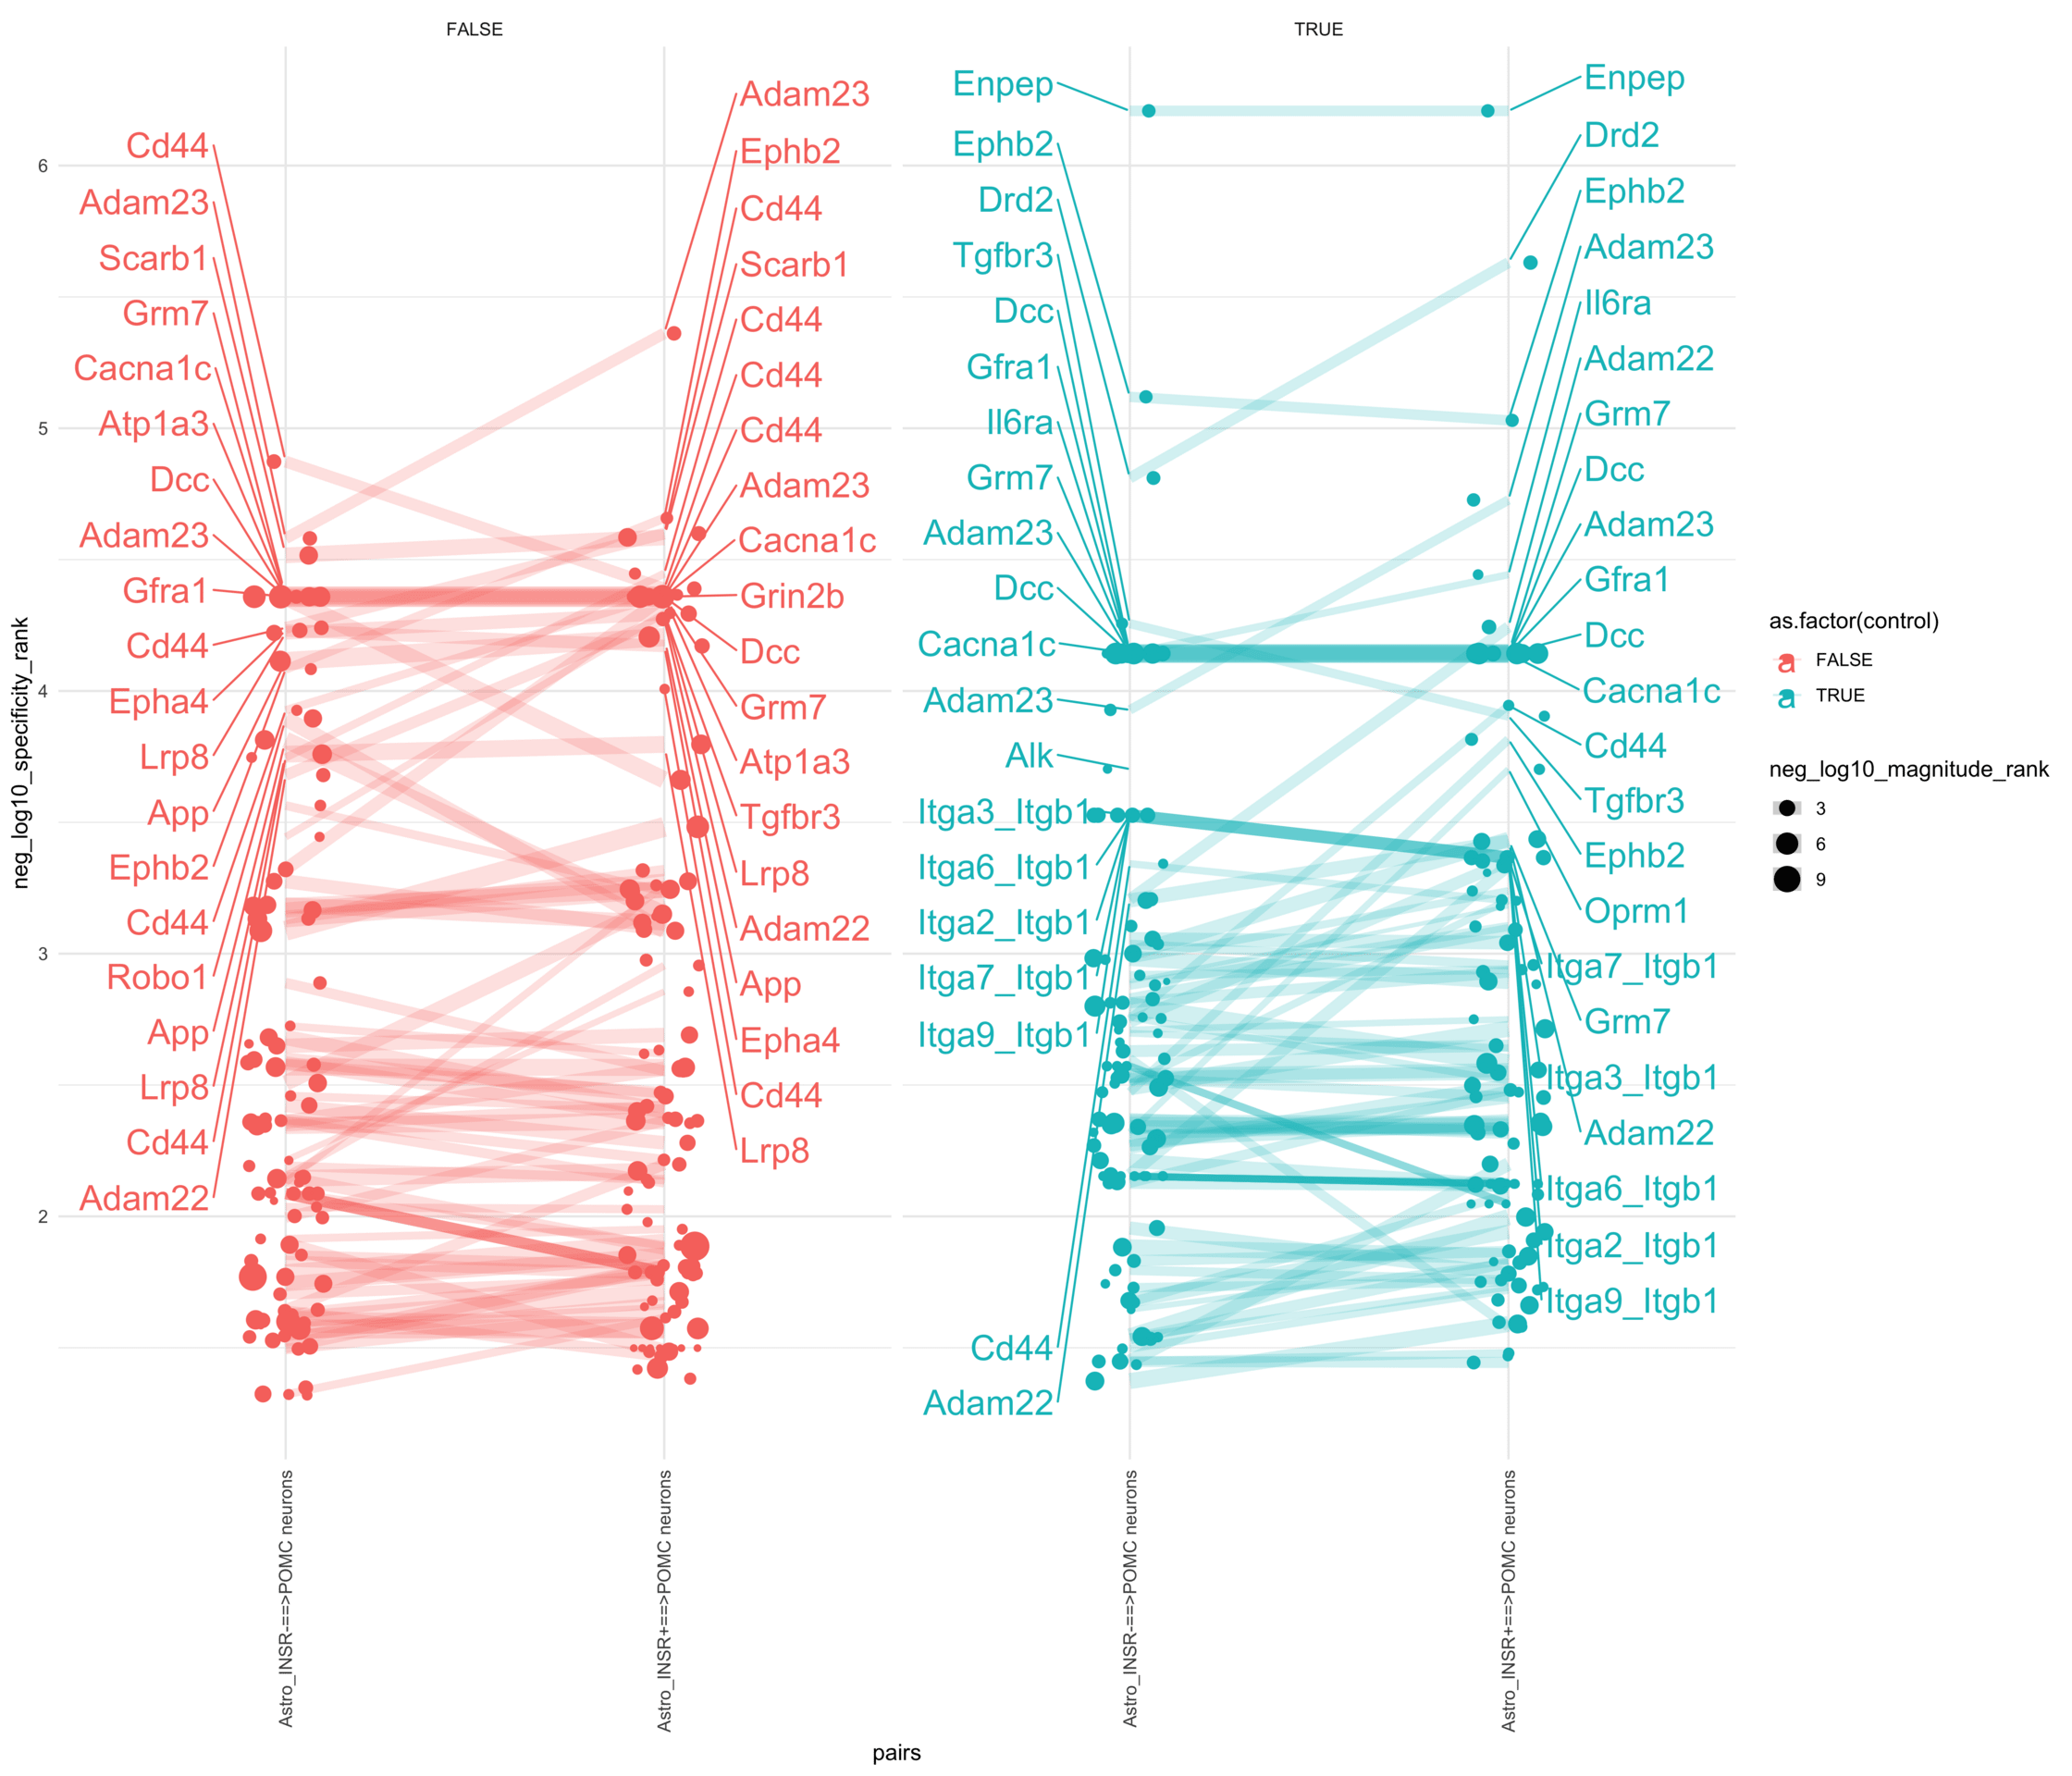
plr <-ggplot(df, aes(x = pairs, y = neg_log10_specificity_rank, color =as.factor(control), size = neg_log10_magnitude_rank)) +geom_jitter(width =0.1) +geom_line(aes(group = lr_complex), linetype ="solid", alpha =0.2) +theme_minimal() +theme(axis.text.x =element_text(angle =90, vjust =0.5, hjust =1)) +facet_wrap(~control)# Add text labels for min and max 5 values within each group using ggrepelplr <- plr +geom_text_repel(data = top_bot_10 %>%filter(pairs =="Astro_INSR+==>POMC neurons"),aes(label = lr_complex,point.size = neg_log10_magnitude_rank ), # data point sizenudge_x =0.2, direction ="y", hjust ="left",size =6, # font size in the text labelspoint.padding =0, # additional padding around each pointmin.segment.length =0, # draw all line segmentsmax.time =5, max.iter =1e6, # stop after 1 second, or after 100,000 iterationsseed = reseed,max.overlaps =Inf,box.padding =0.5) +geom_text_repel(data = top_bot_10 %>%filter(pairs =="Astro_INSR-==>POMC neurons"),aes(label = lr_complex,point.size = neg_log10_magnitude_rank ), # data point sizenudge_x =-.2, direction ="y", hjust ="right",size =6, # font size in the text labelspoint.padding =0, # additional padding around each pointmin.segment.length =0, # draw all line segmentsmax.time =5, max.iter =1e6, # stop after 1 second, or after 100,000 iterationsseed = reseed,max.overlaps =Inf,box.padding =0.5)print(plr)
dabestr (Data Analysis with Bootstrap Estimation in R) v0.3.0
=============================================================
Good afternoon!
The current time is 13:39 PM on Saturday July 29, 2023.
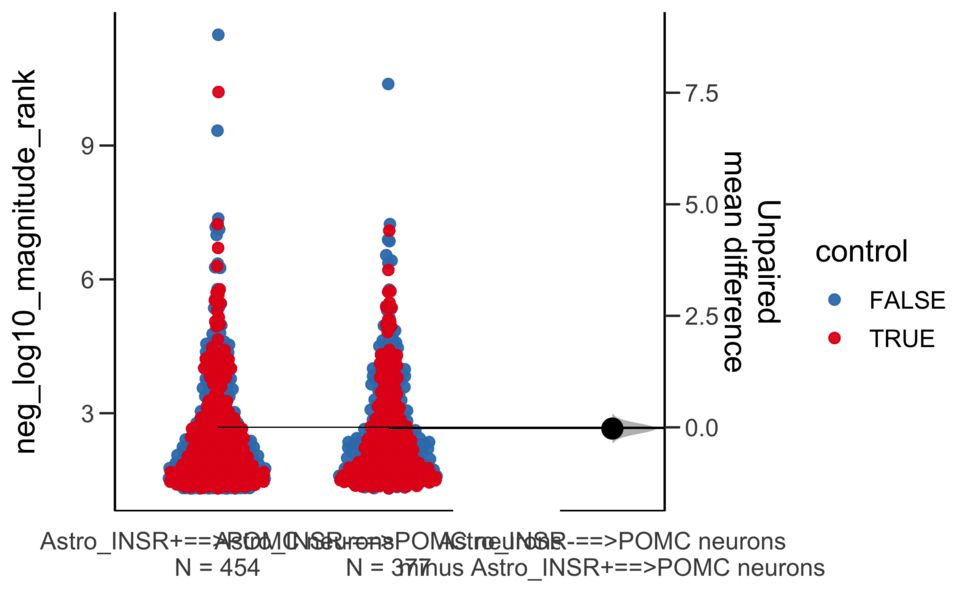
Dataset : df.two.group.unpaired
X Variable : pairs
Y Variable : neg_log10_specificity_rank
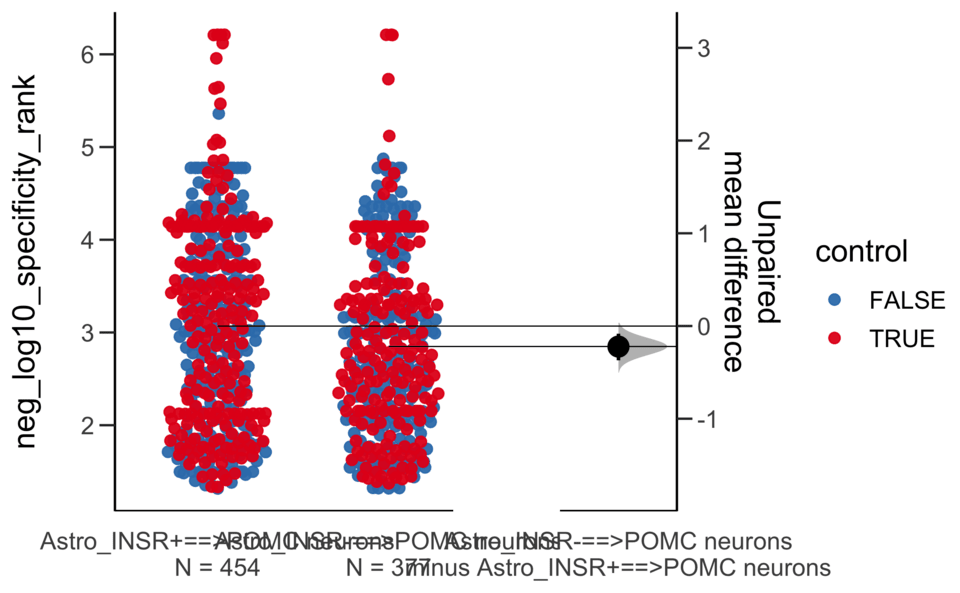
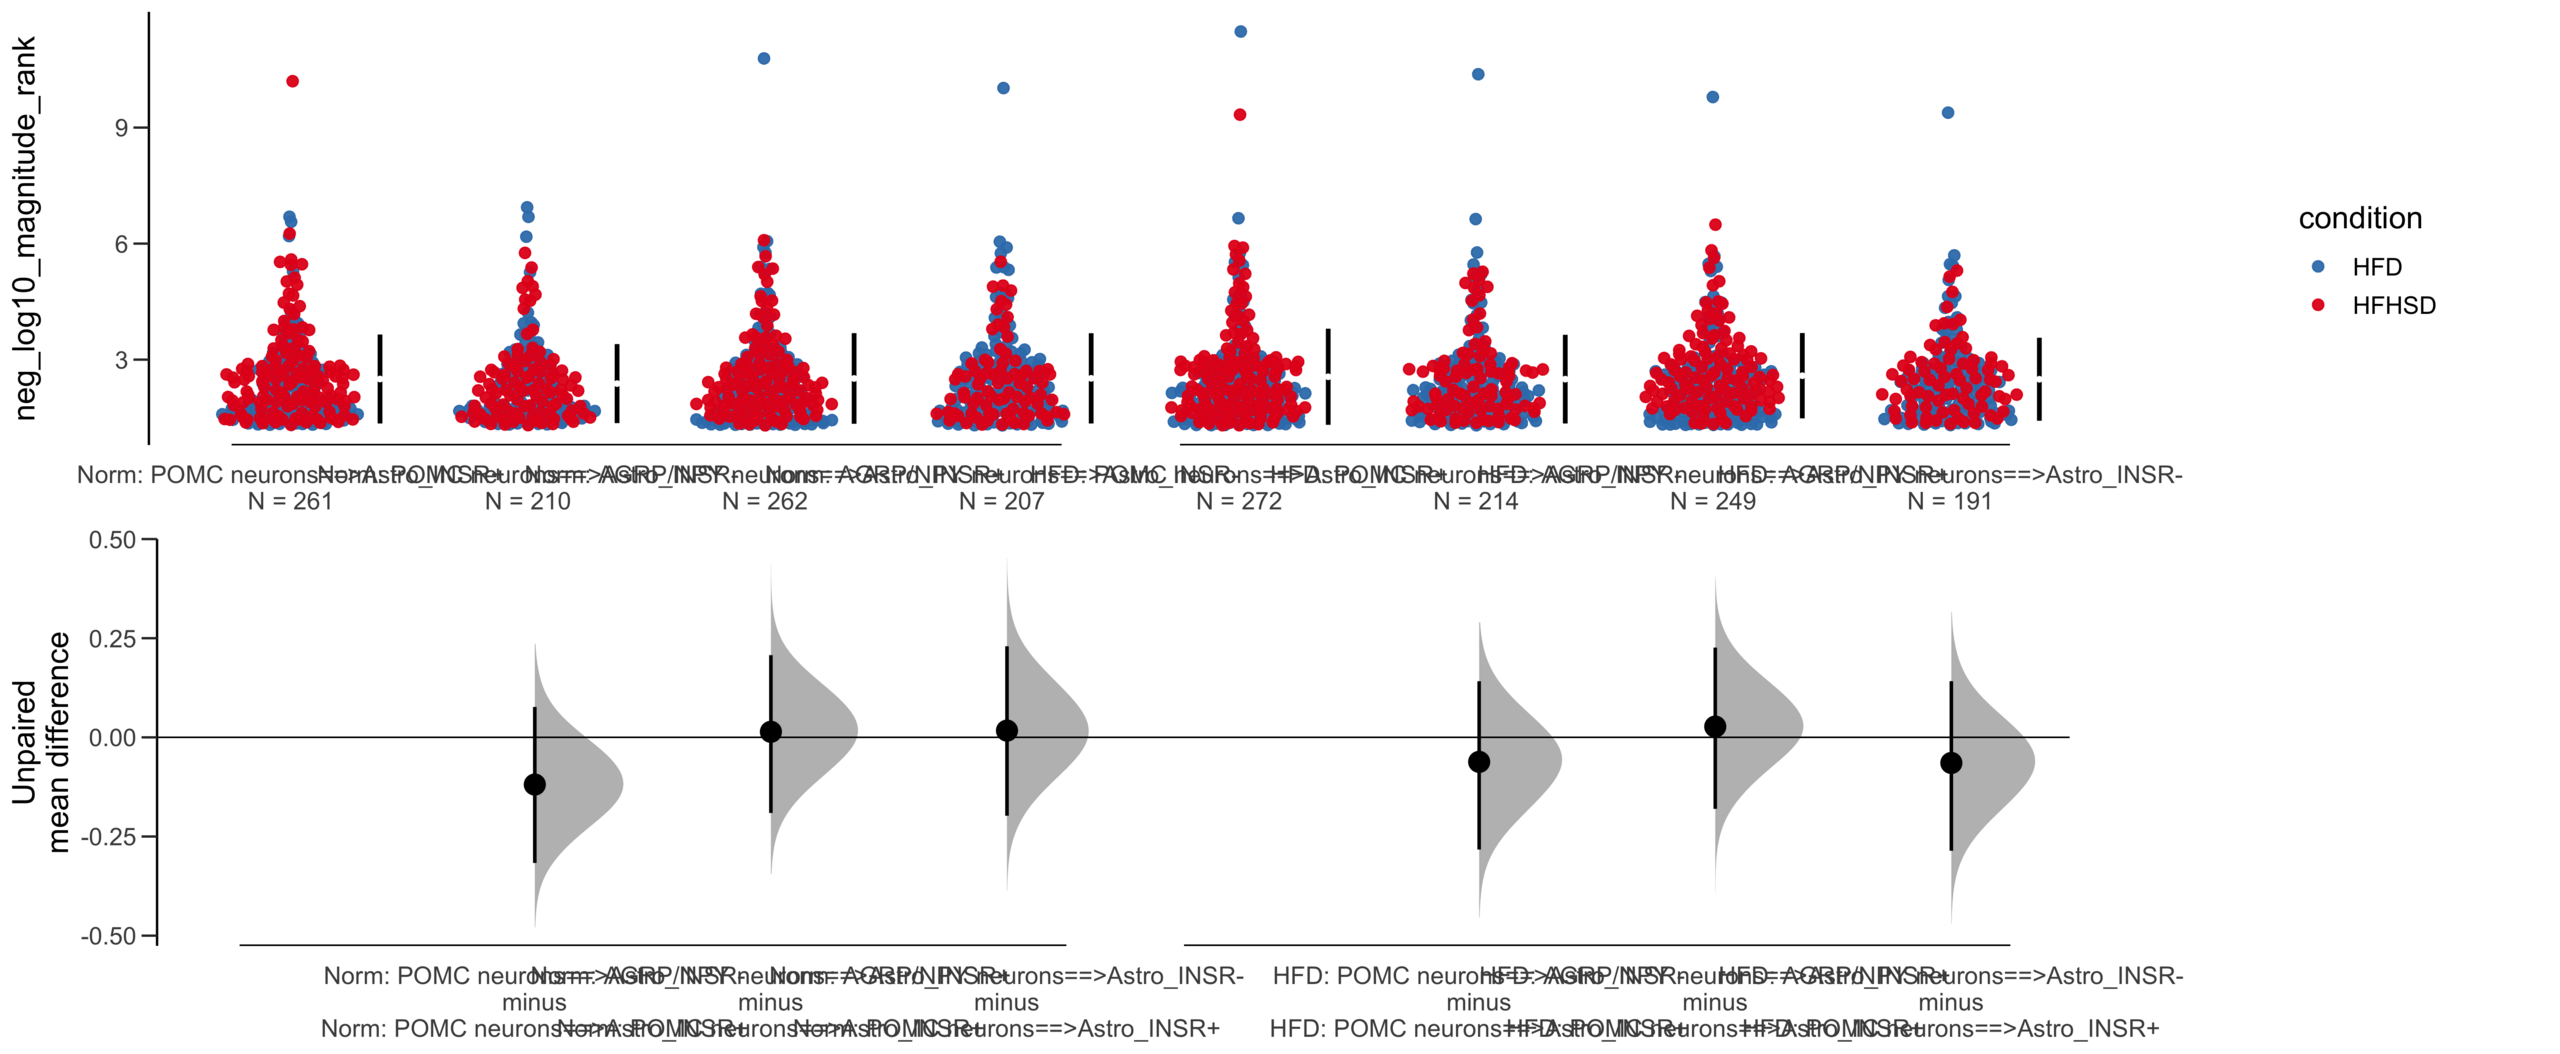
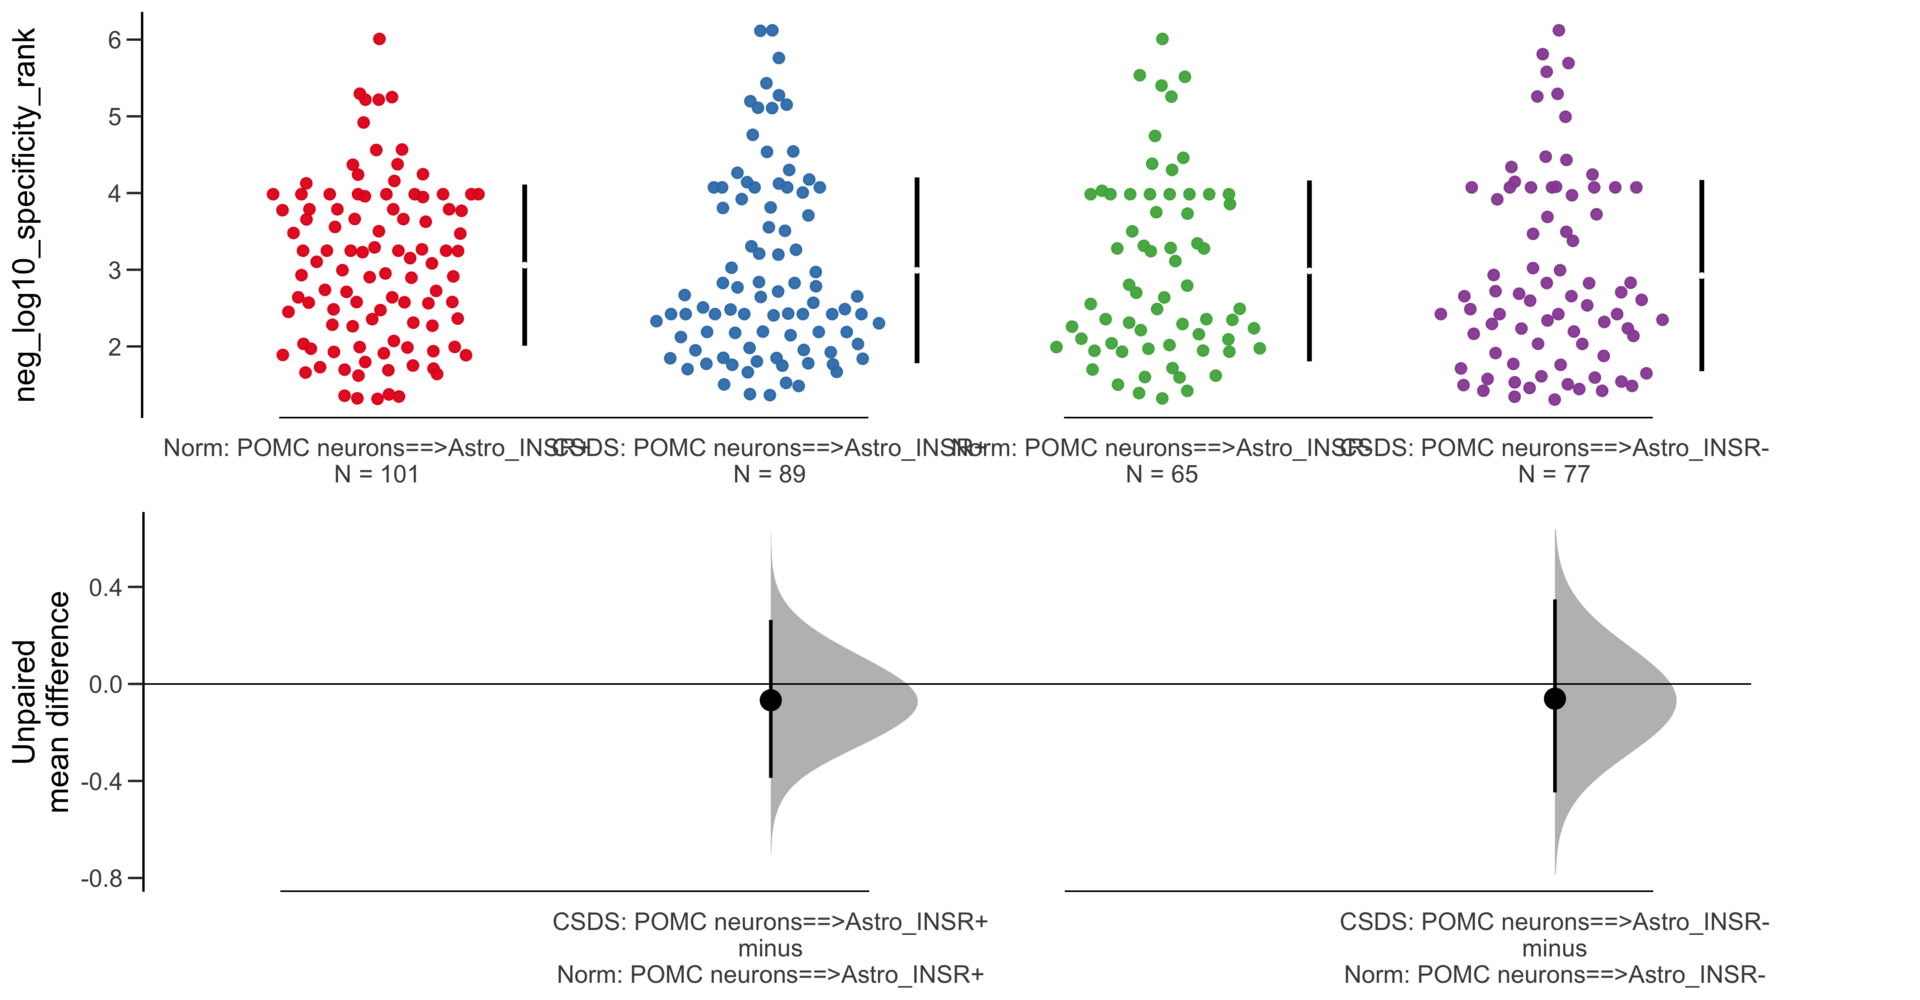
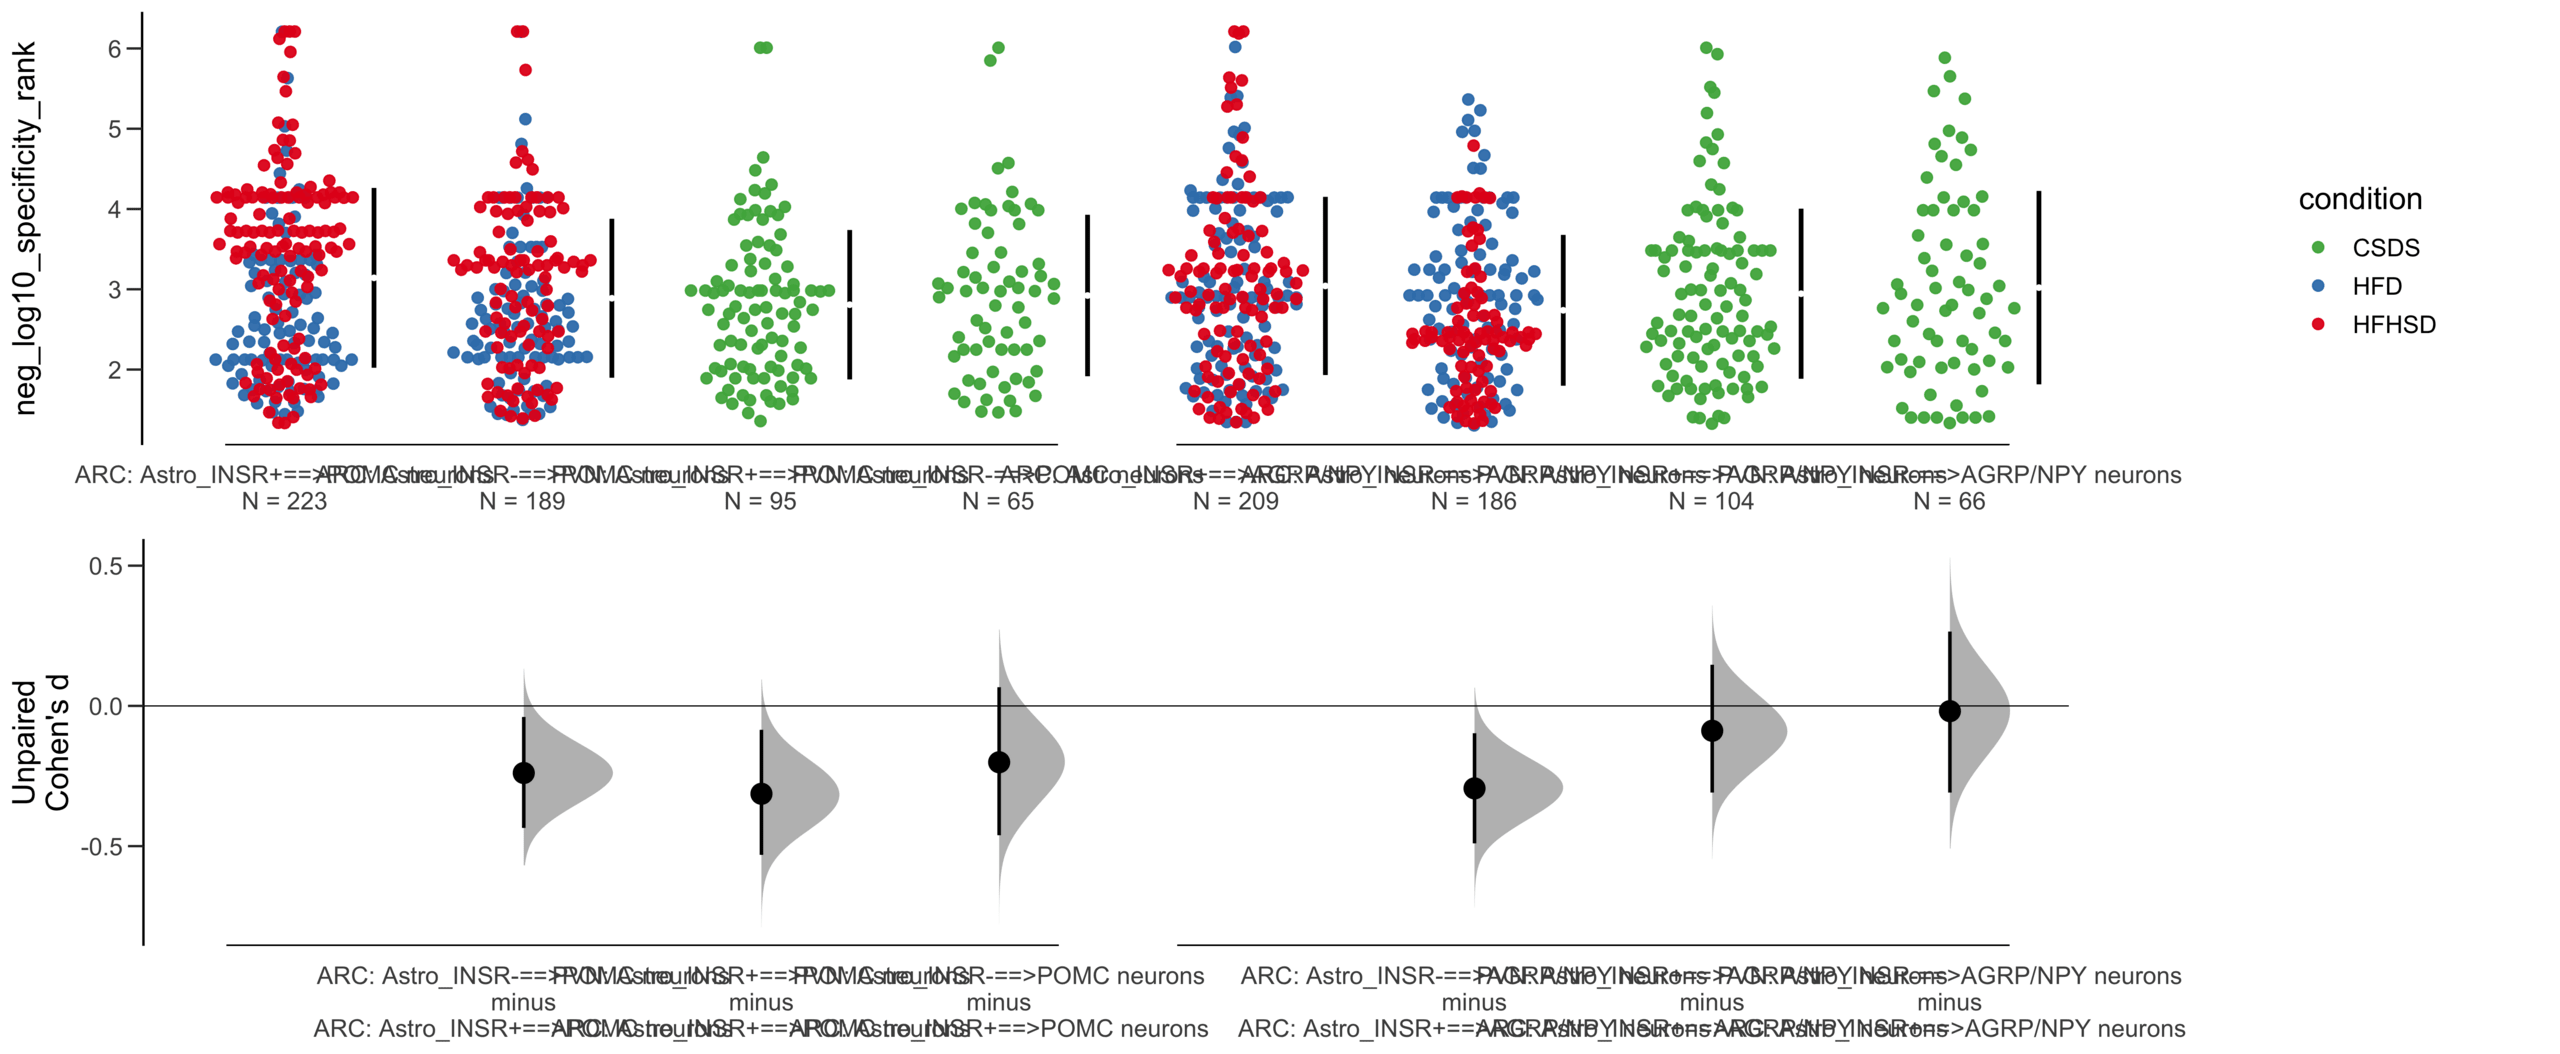
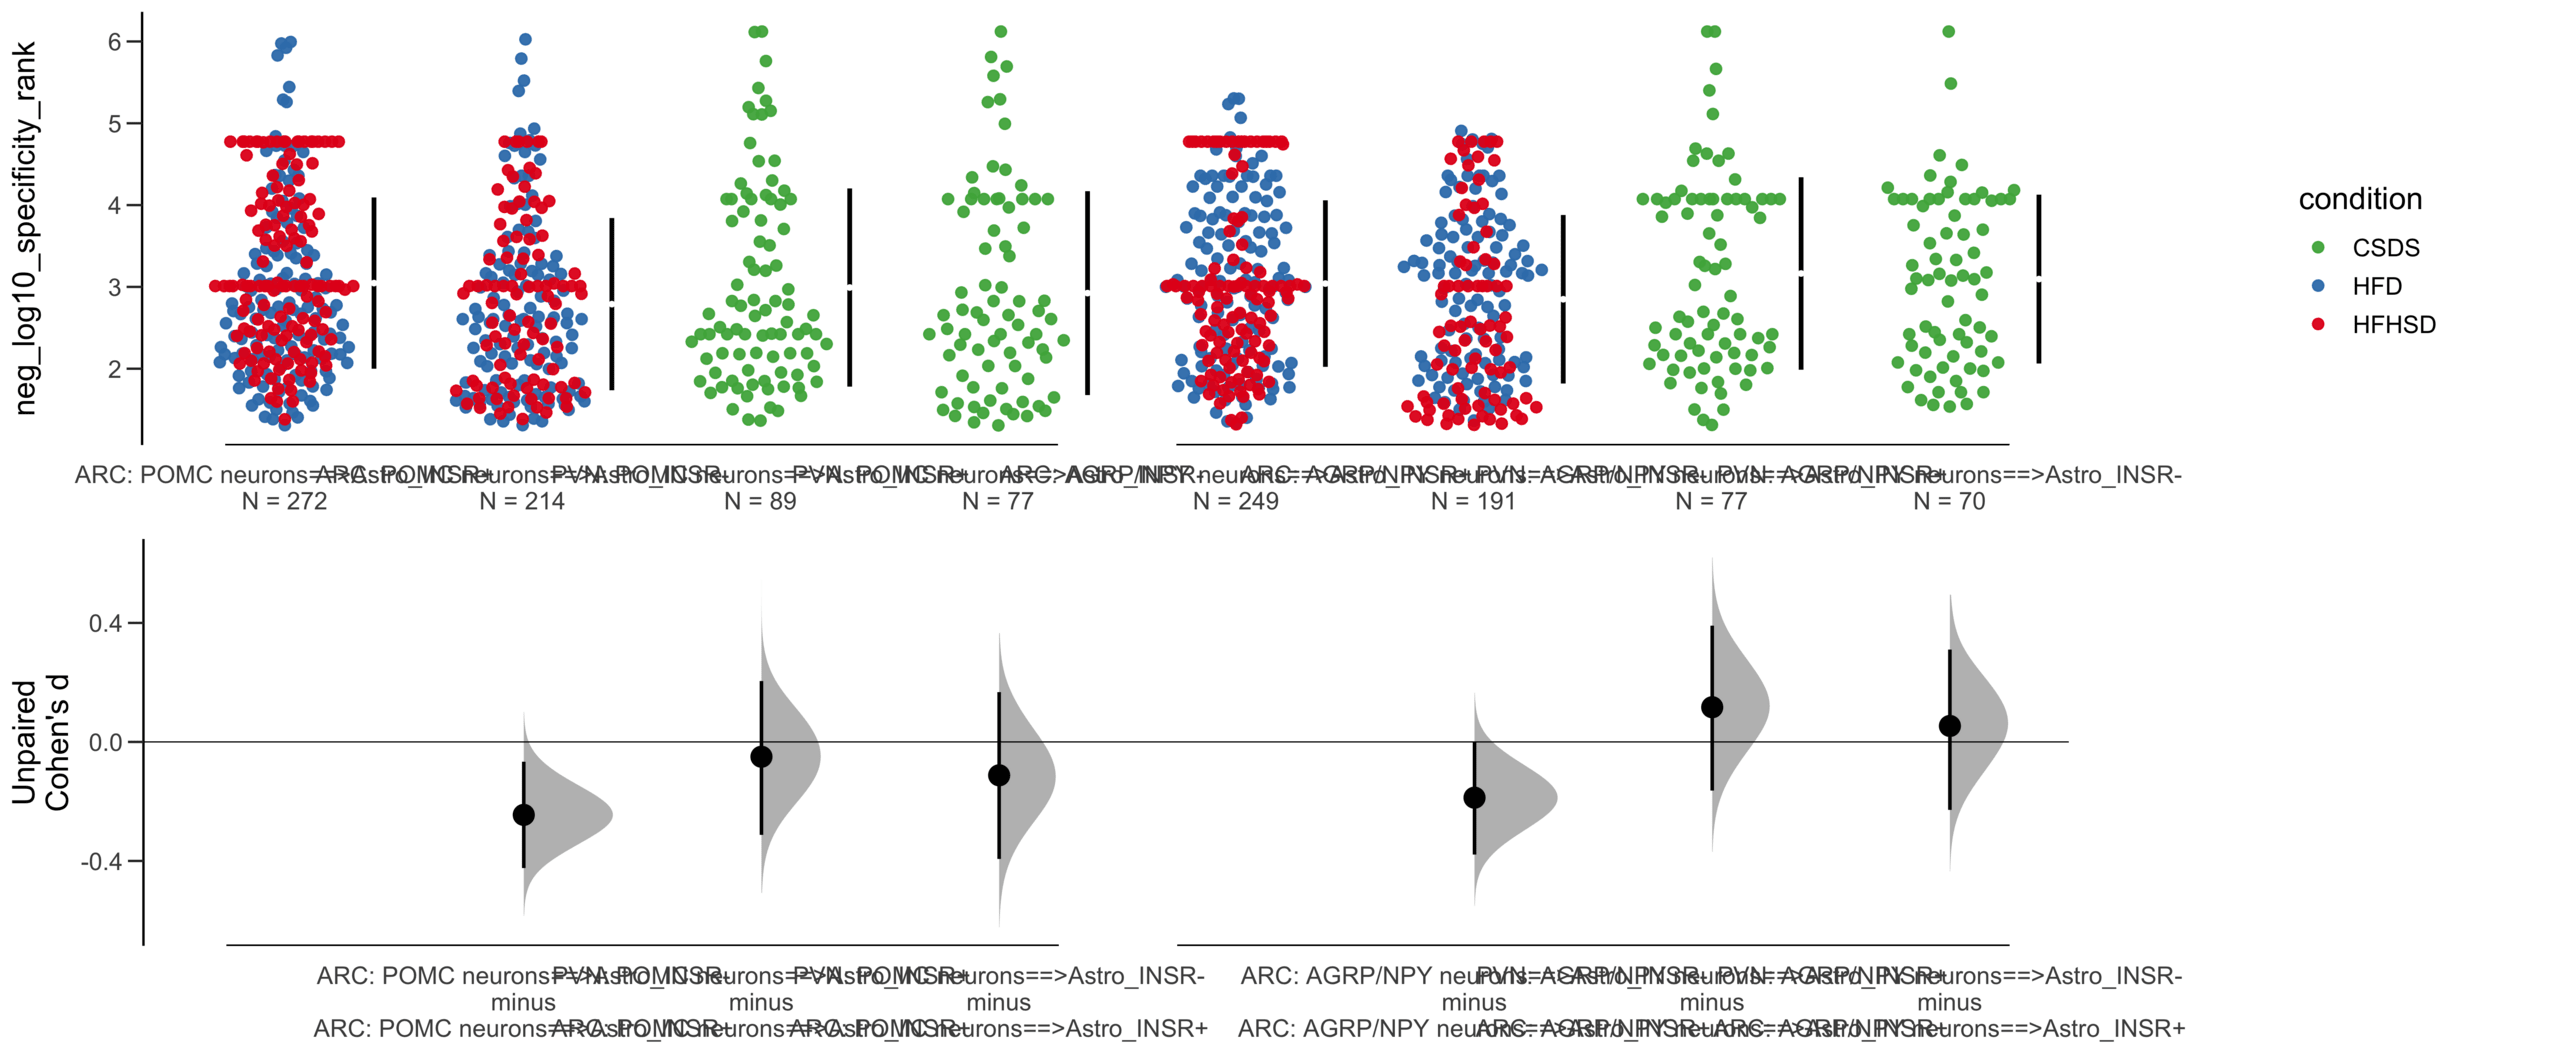
Unpaired mean difference of Astro_INSR-==>POMC neurons (n = 377) minus Astro_INSR+==>POMC neurons (n = 454)
-0.222 [95CI -0.37; -0.0832]
5000 bootstrap resamples.
All confidence intervals are bias-corrected and accelerated.
dabestr (Data Analysis with Bootstrap Estimation in R) v0.3.0
=============================================================
Good afternoon!
The current time is 13:39 PM on Saturday July 29, 2023.
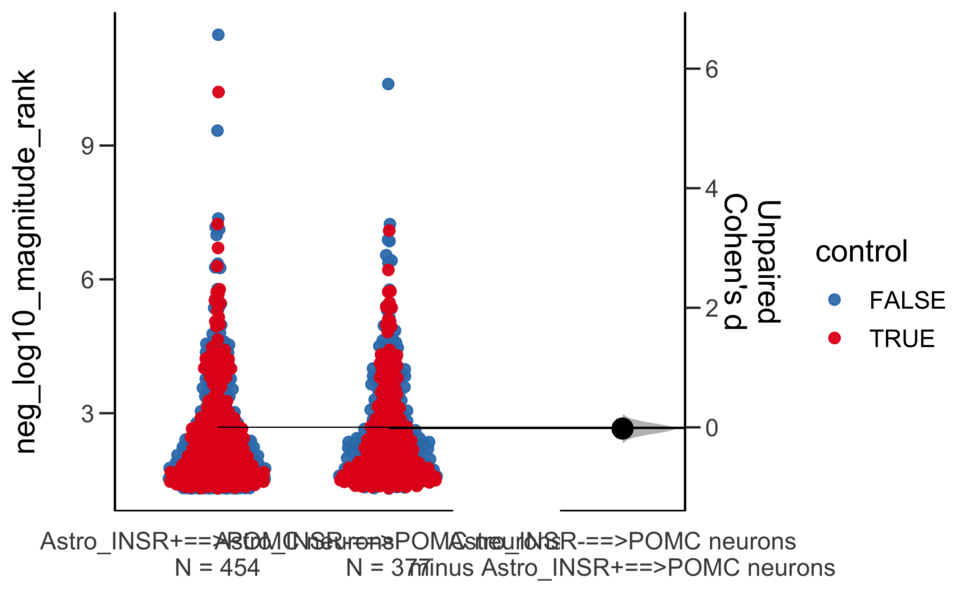
Dataset : df.two.group.unpaired
X Variable : pairs
Y Variable : neg_log10_specificity_rank
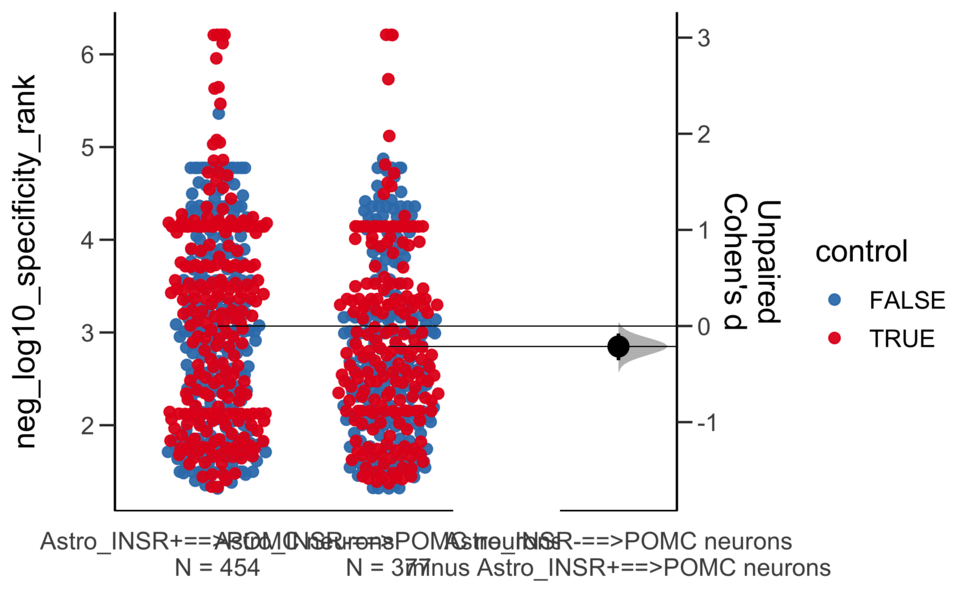
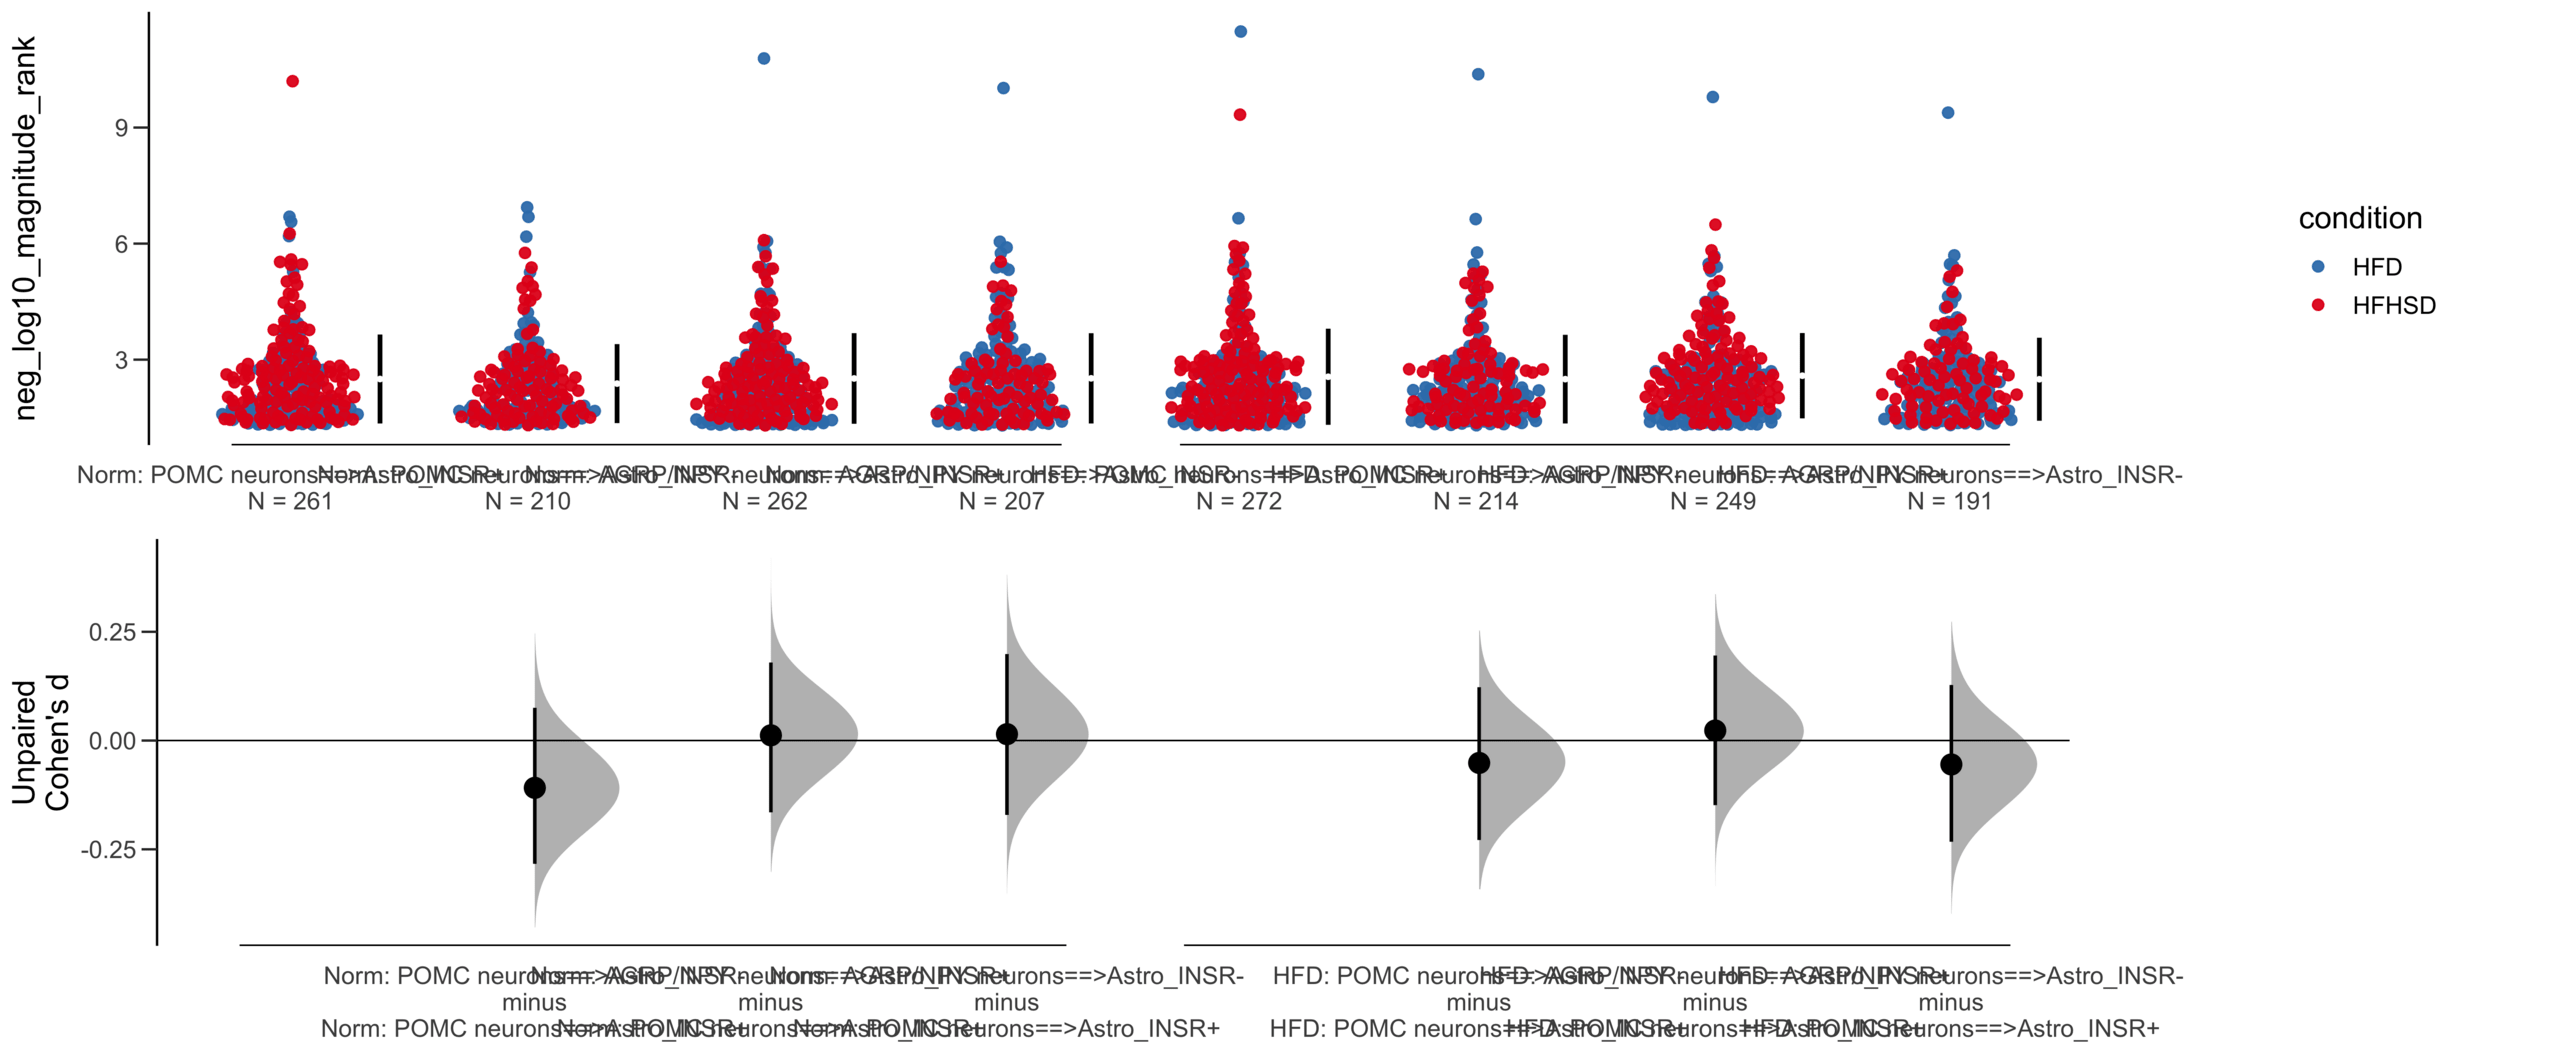
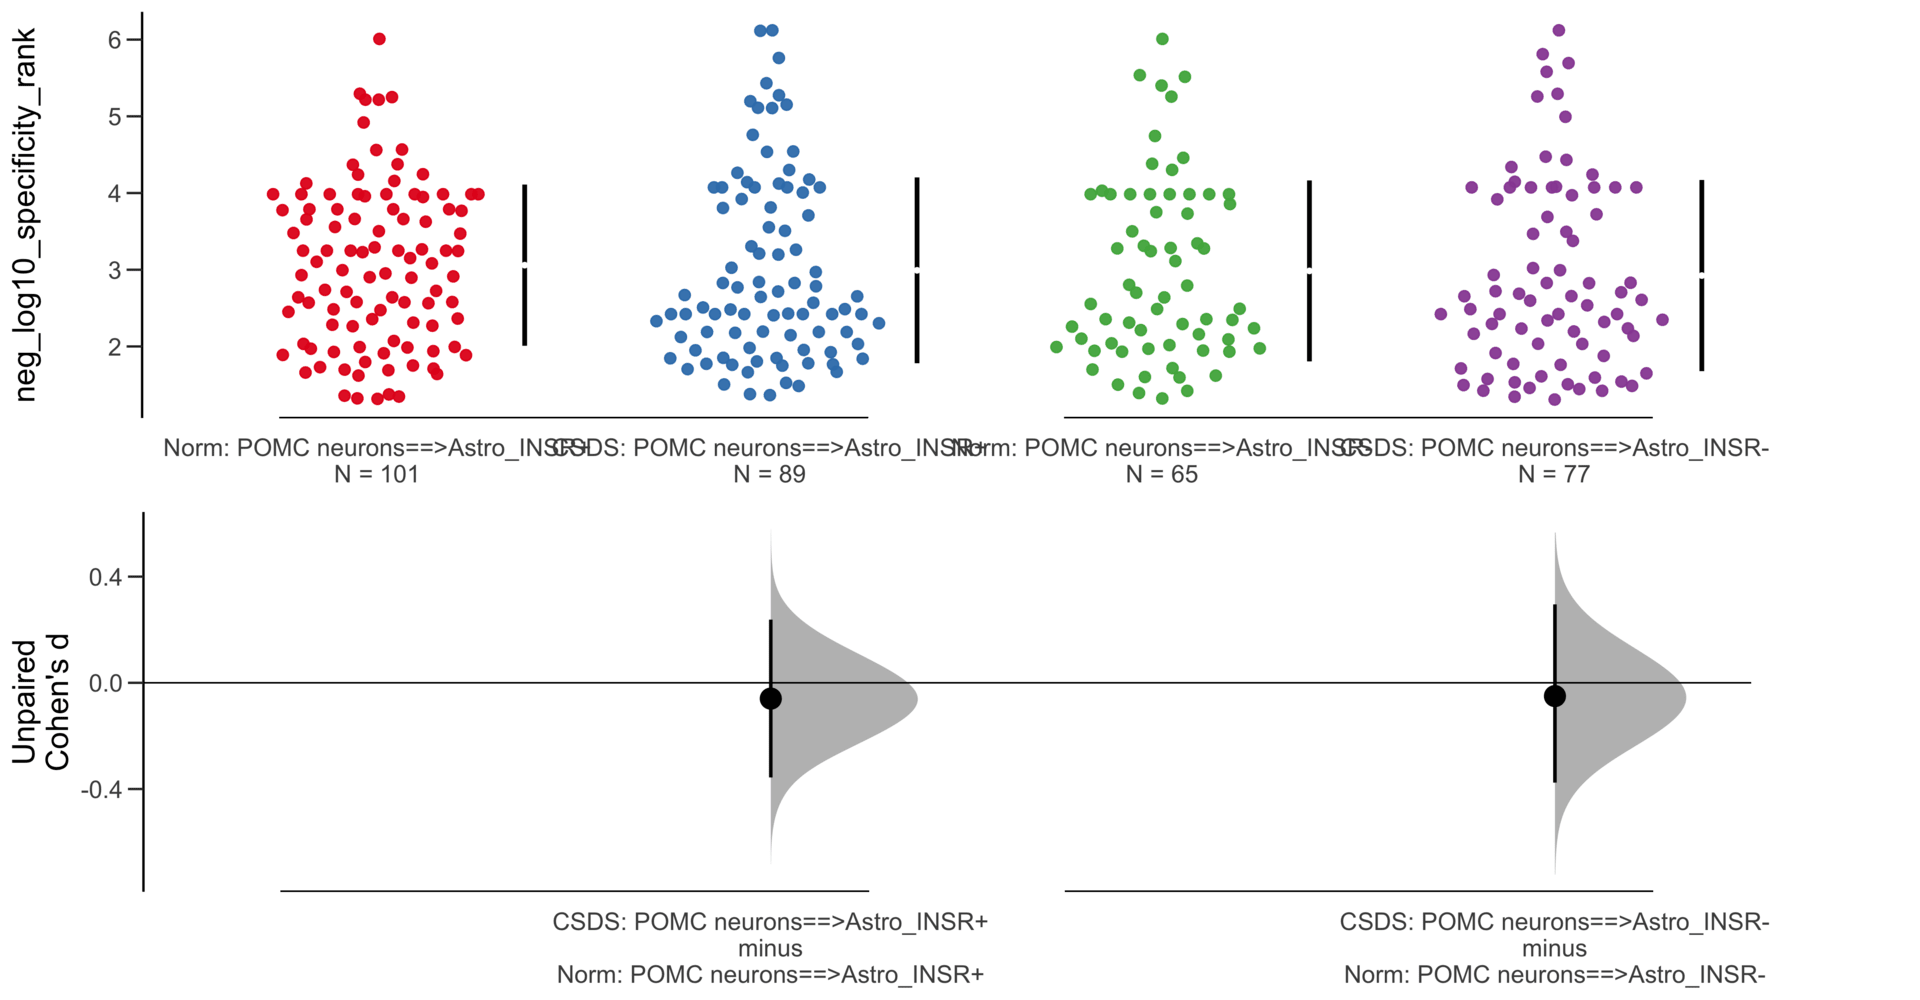
Unpaired Cohen's d of Astro_INSR-==>POMC neurons (n = 377) minus Astro_INSR+==>POMC neurons (n = 454)
-0.213 [95CI -0.356; -0.0781]
5000 bootstrap resamples.
All confidence intervals are bias-corrected and accelerated.
dabestr (Data Analysis with Bootstrap Estimation in R) v0.3.0
=============================================================
Good afternoon!
The current time is 13:40 PM on Saturday July 29, 2023.
Dataset : df.two.group.unpaired
X Variable : pairs
Y Variable : neg_log10_magnitude_rank
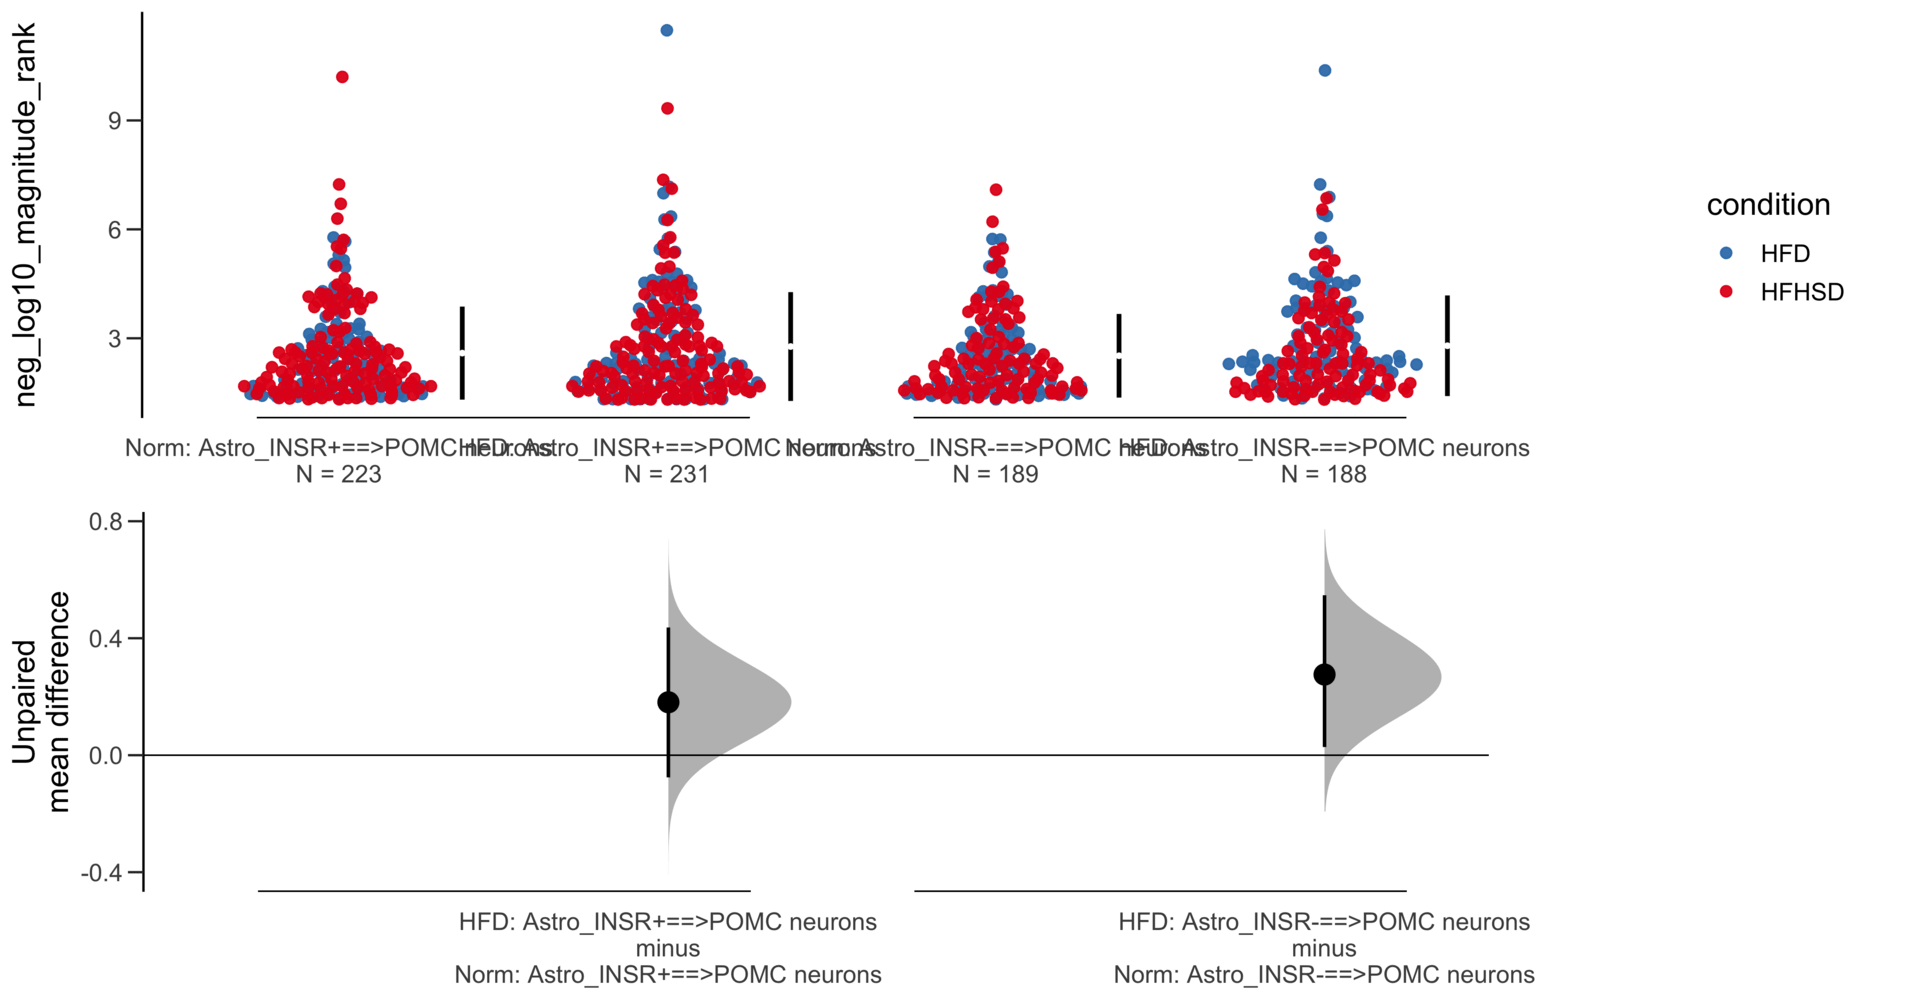
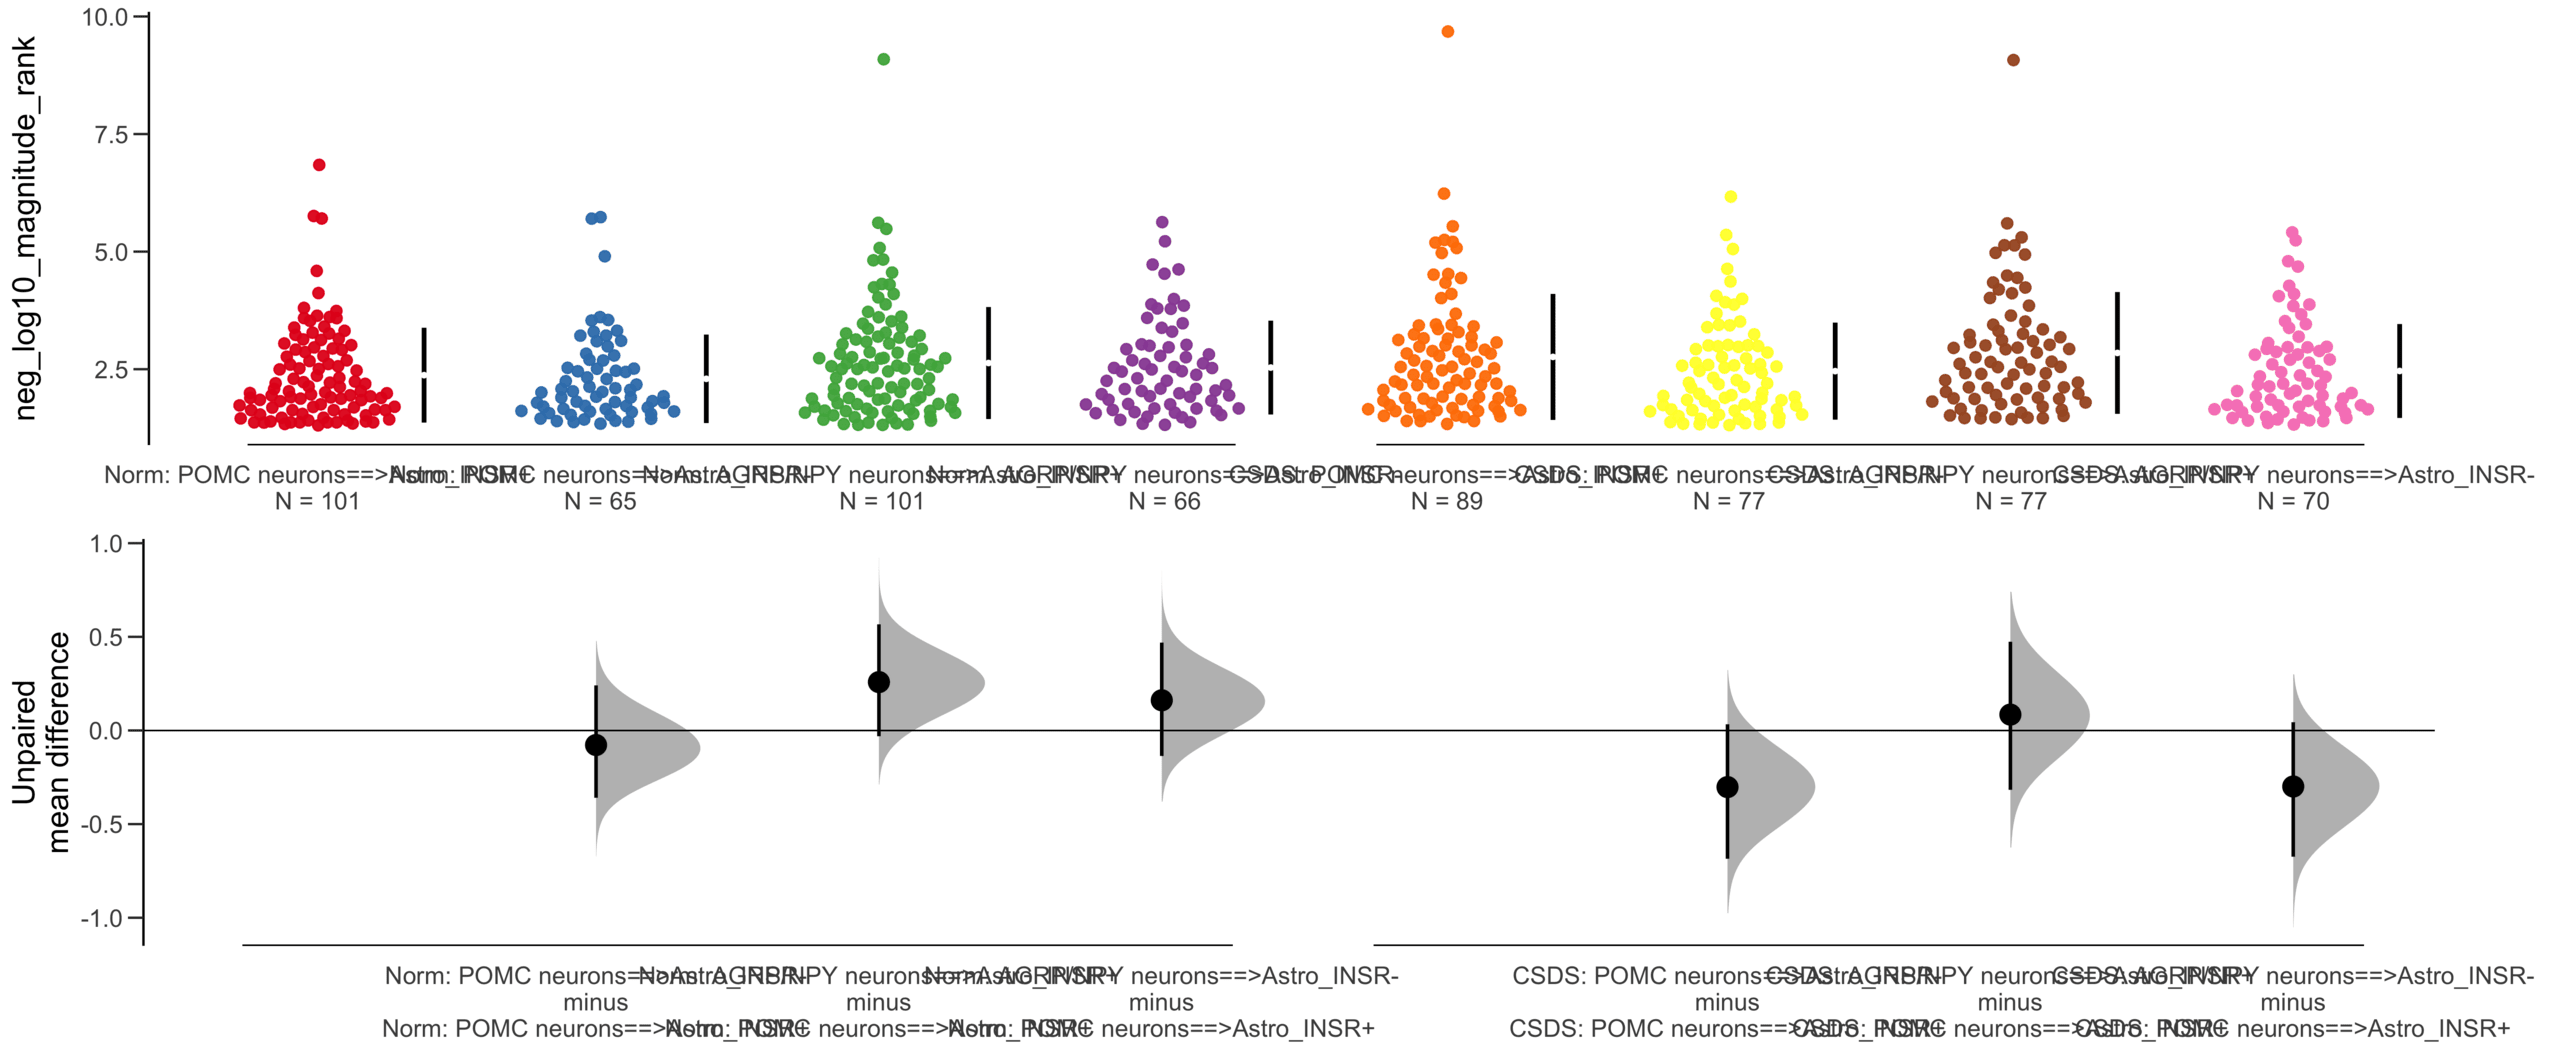
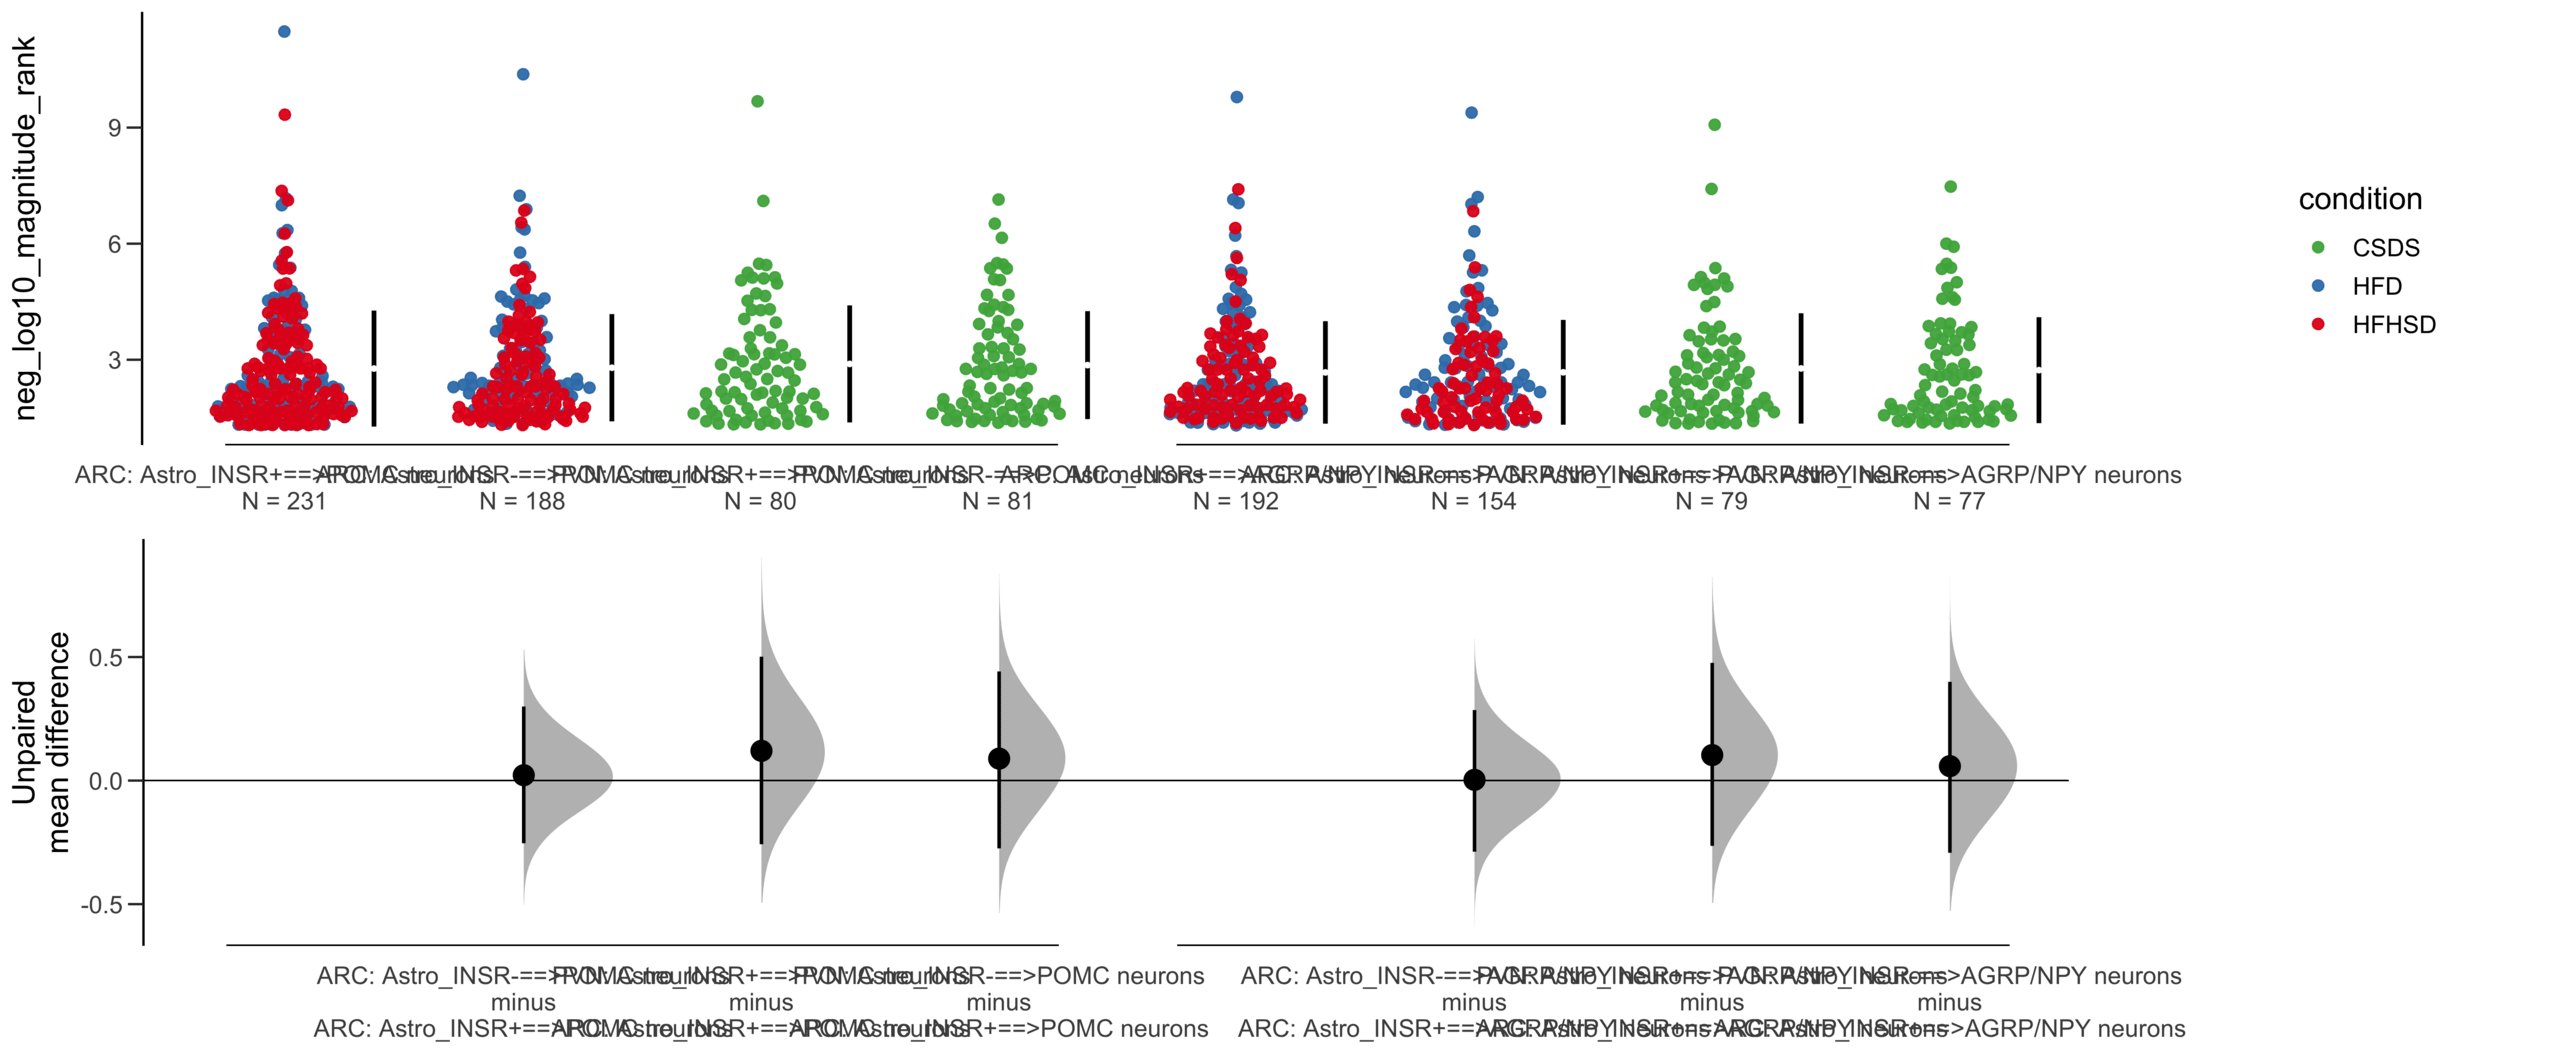
Unpaired mean difference of Astro_INSR-==>POMC neurons (n = 377) minus Astro_INSR+==>POMC neurons (n = 454)
-0.0276 [95CI -0.216; 0.154]
5000 bootstrap resamples.
All confidence intervals are bias-corrected and accelerated.
dabestr (Data Analysis with Bootstrap Estimation in R) v0.3.0
=============================================================
Good afternoon!
The current time is 13:40 PM on Saturday July 29, 2023.
Dataset : df.two.group.unpaired
X Variable : pairs
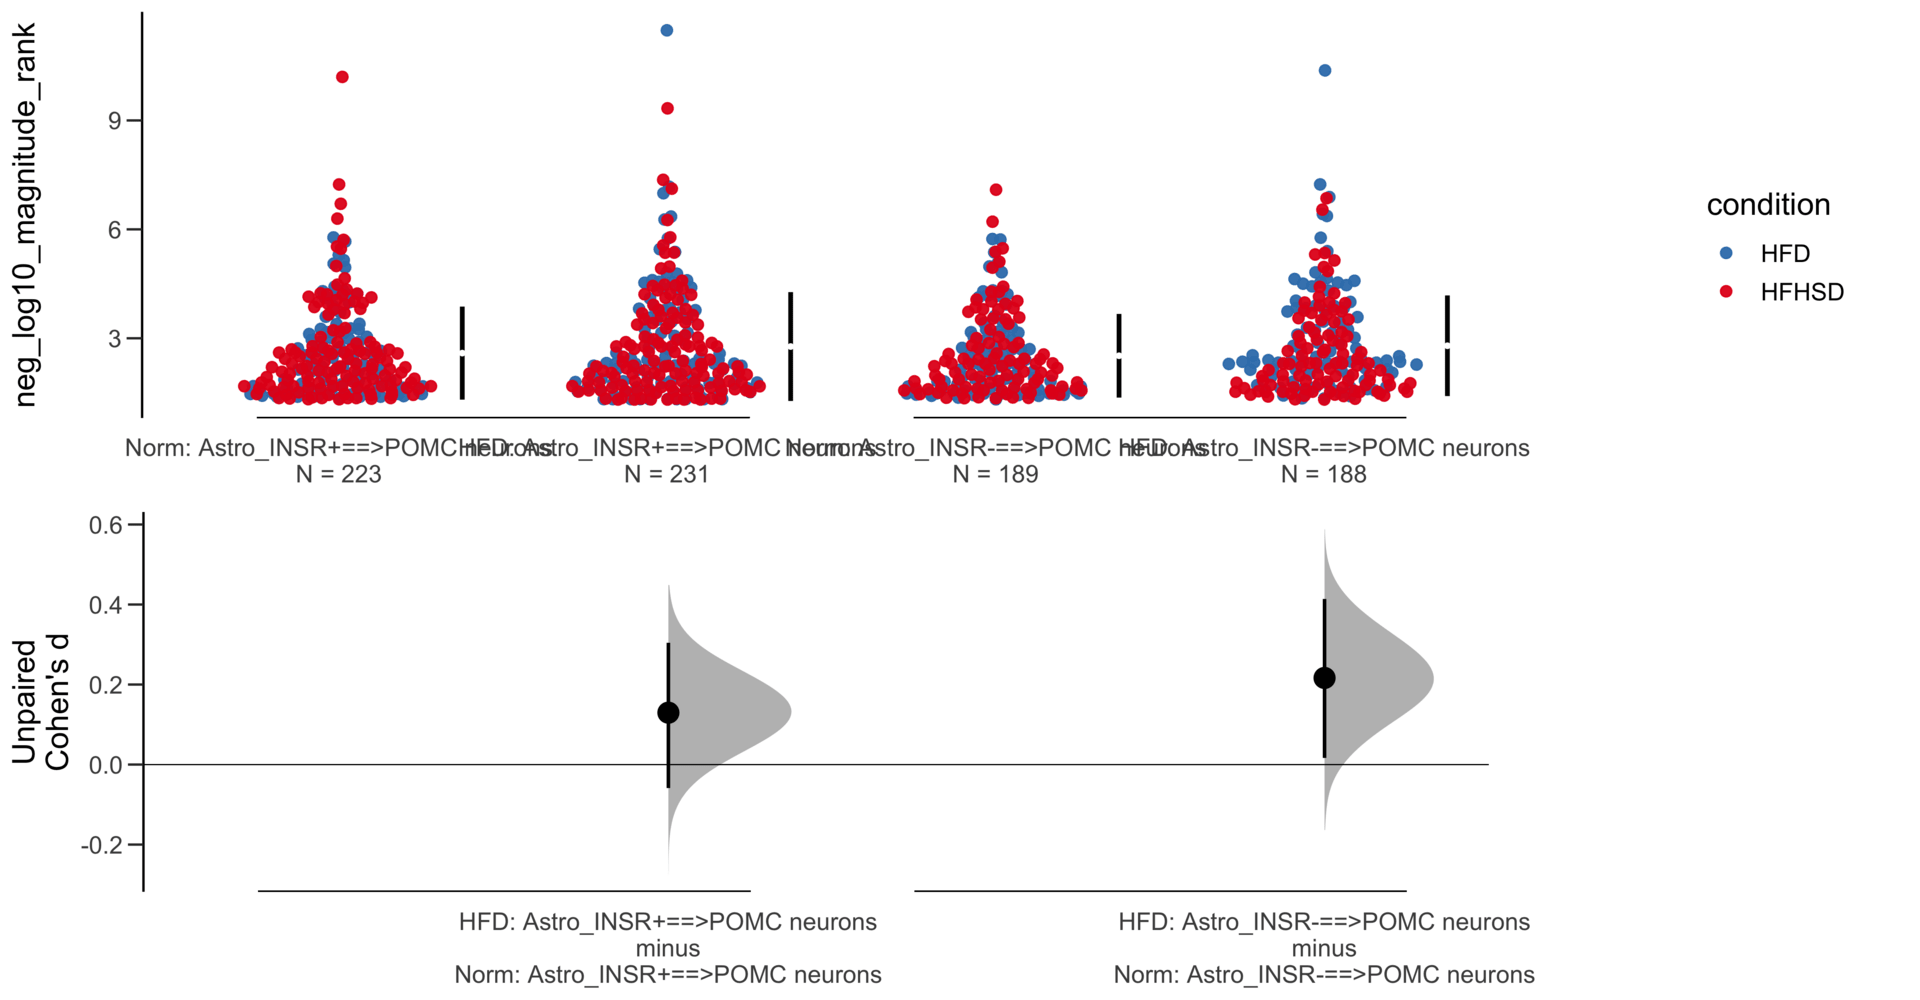
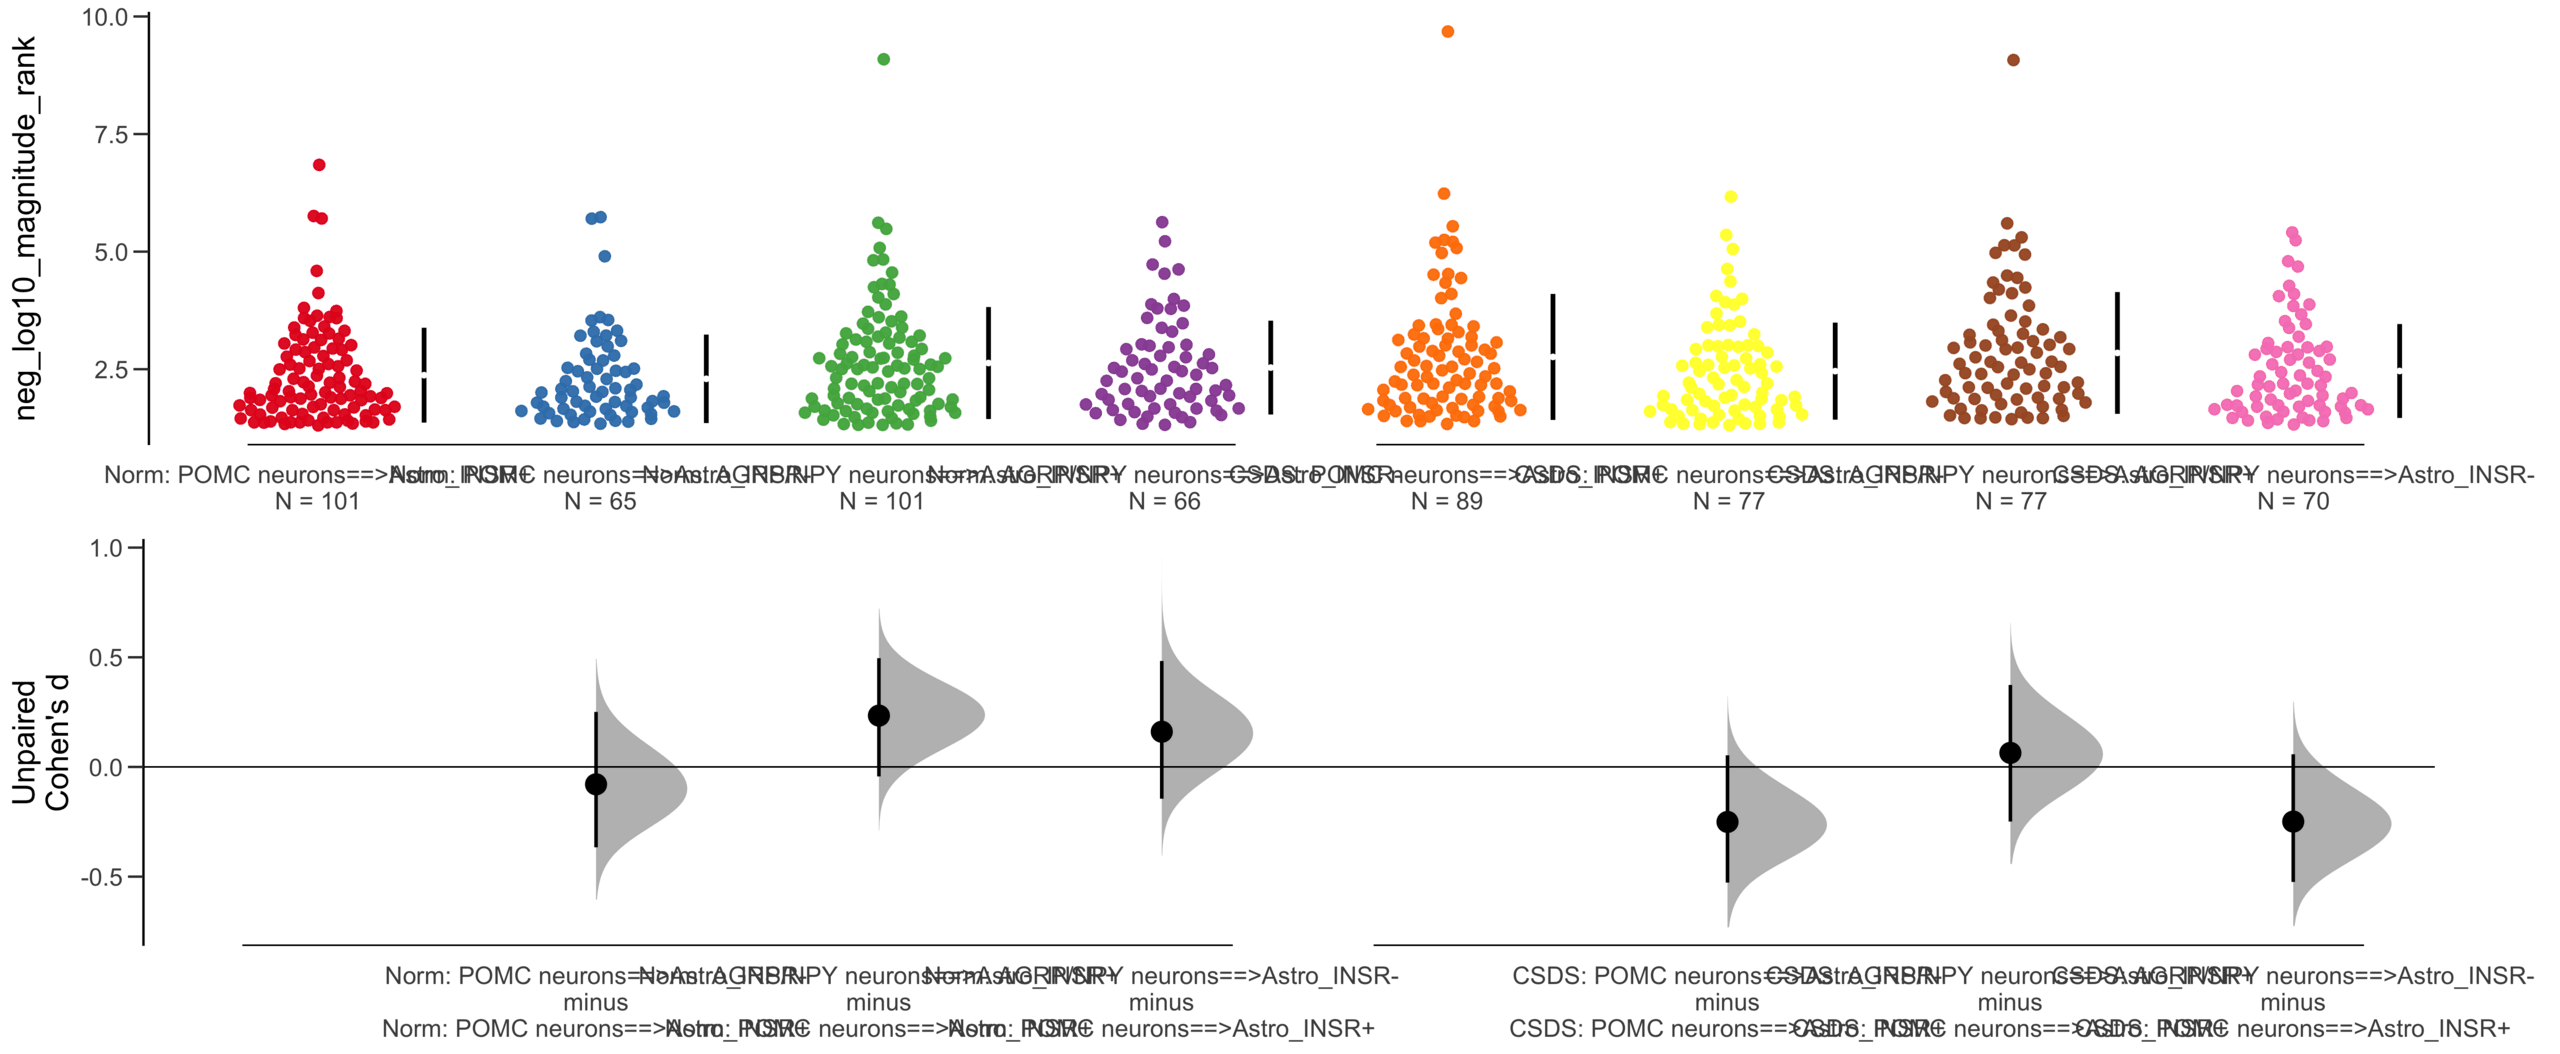
Y Variable : neg_log10_magnitude_rank
Unpaired Cohen's d of Astro_INSR-==>POMC neurons (n = 377) minus Astro_INSR+==>POMC neurons (n = 454)
-0.0205 [95CI -0.157; 0.118]
5000 bootstrap resamples.
All confidence intervals are bias-corrected and accelerated.
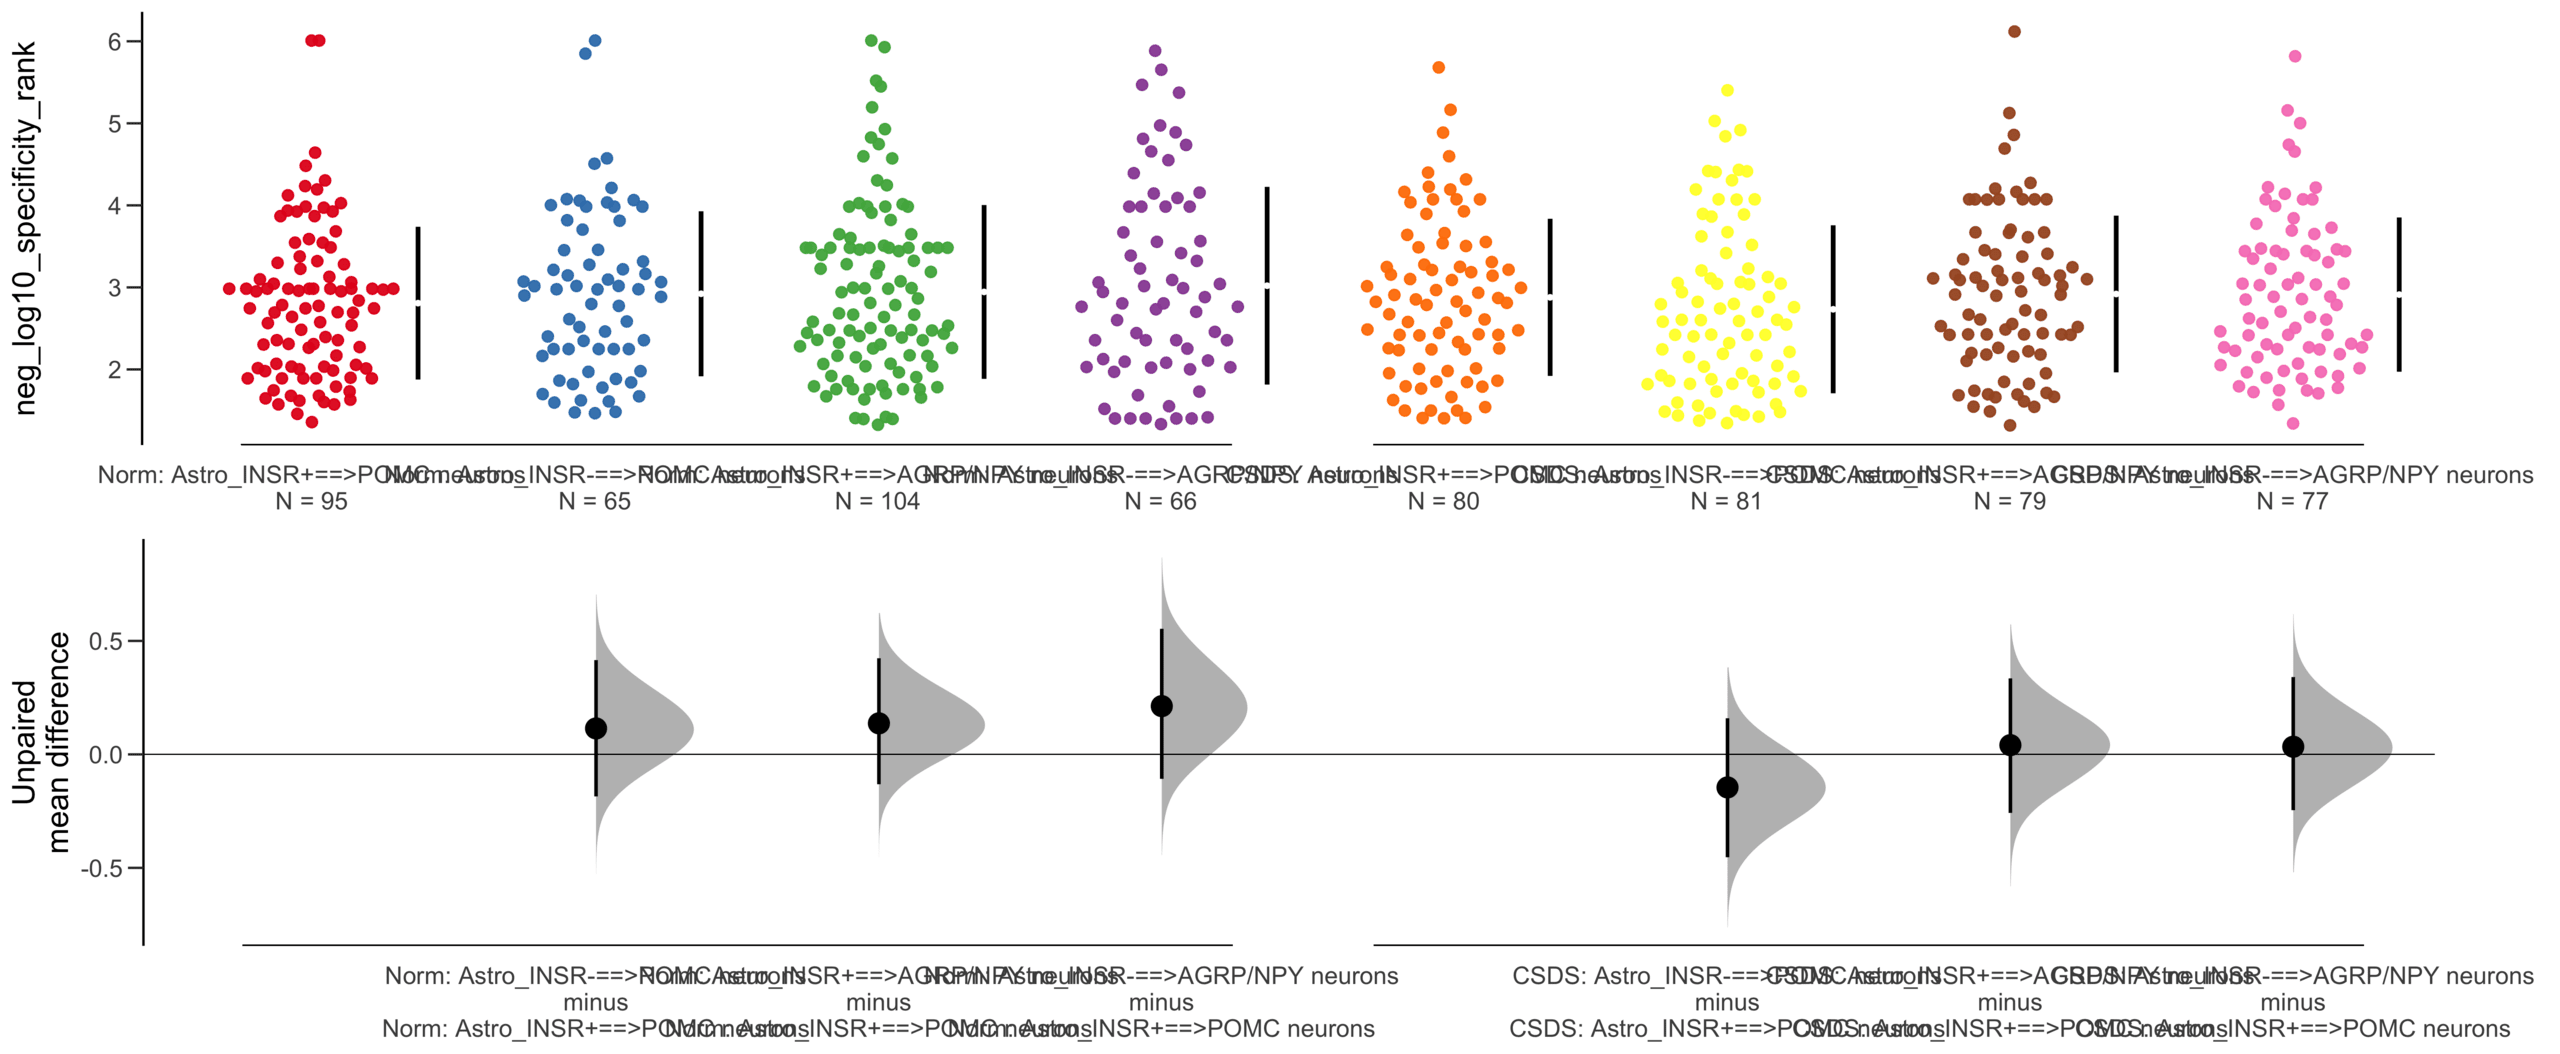
dabestr (Data Analysis with Bootstrap Estimation in R) v0.3.0
=============================================================
Good afternoon!
The current time is 13:40 PM on Saturday July 29, 2023.
Dataset : df.two.group.unpaired
X Variable : pairs
Y Variable : neg_log10_specificity_rank
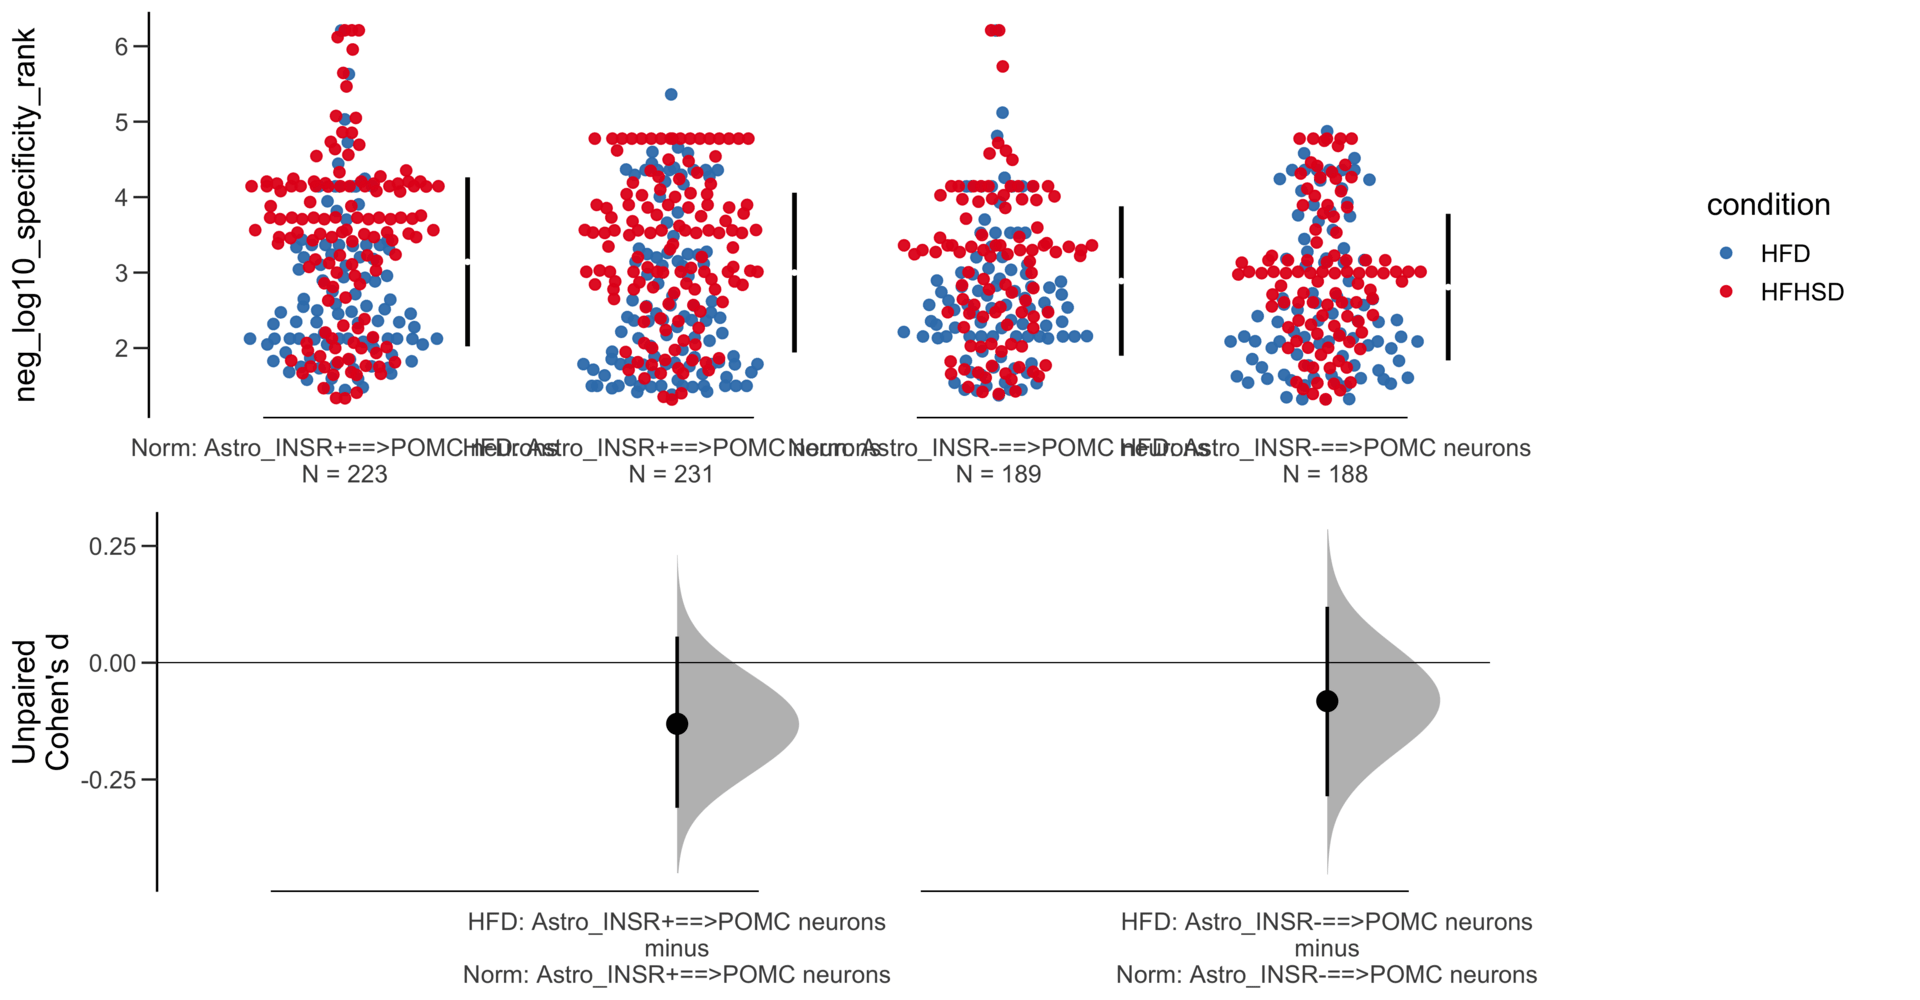
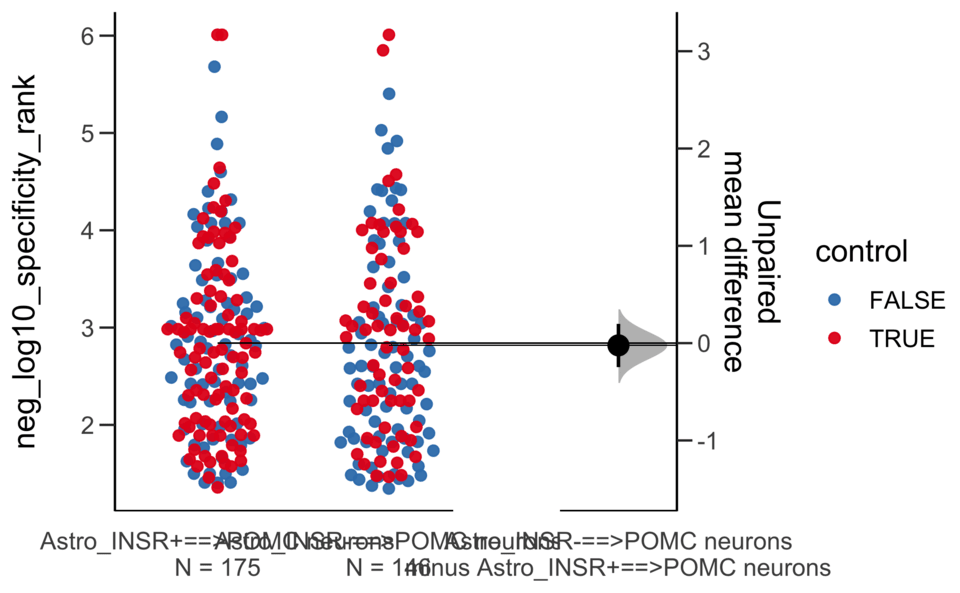
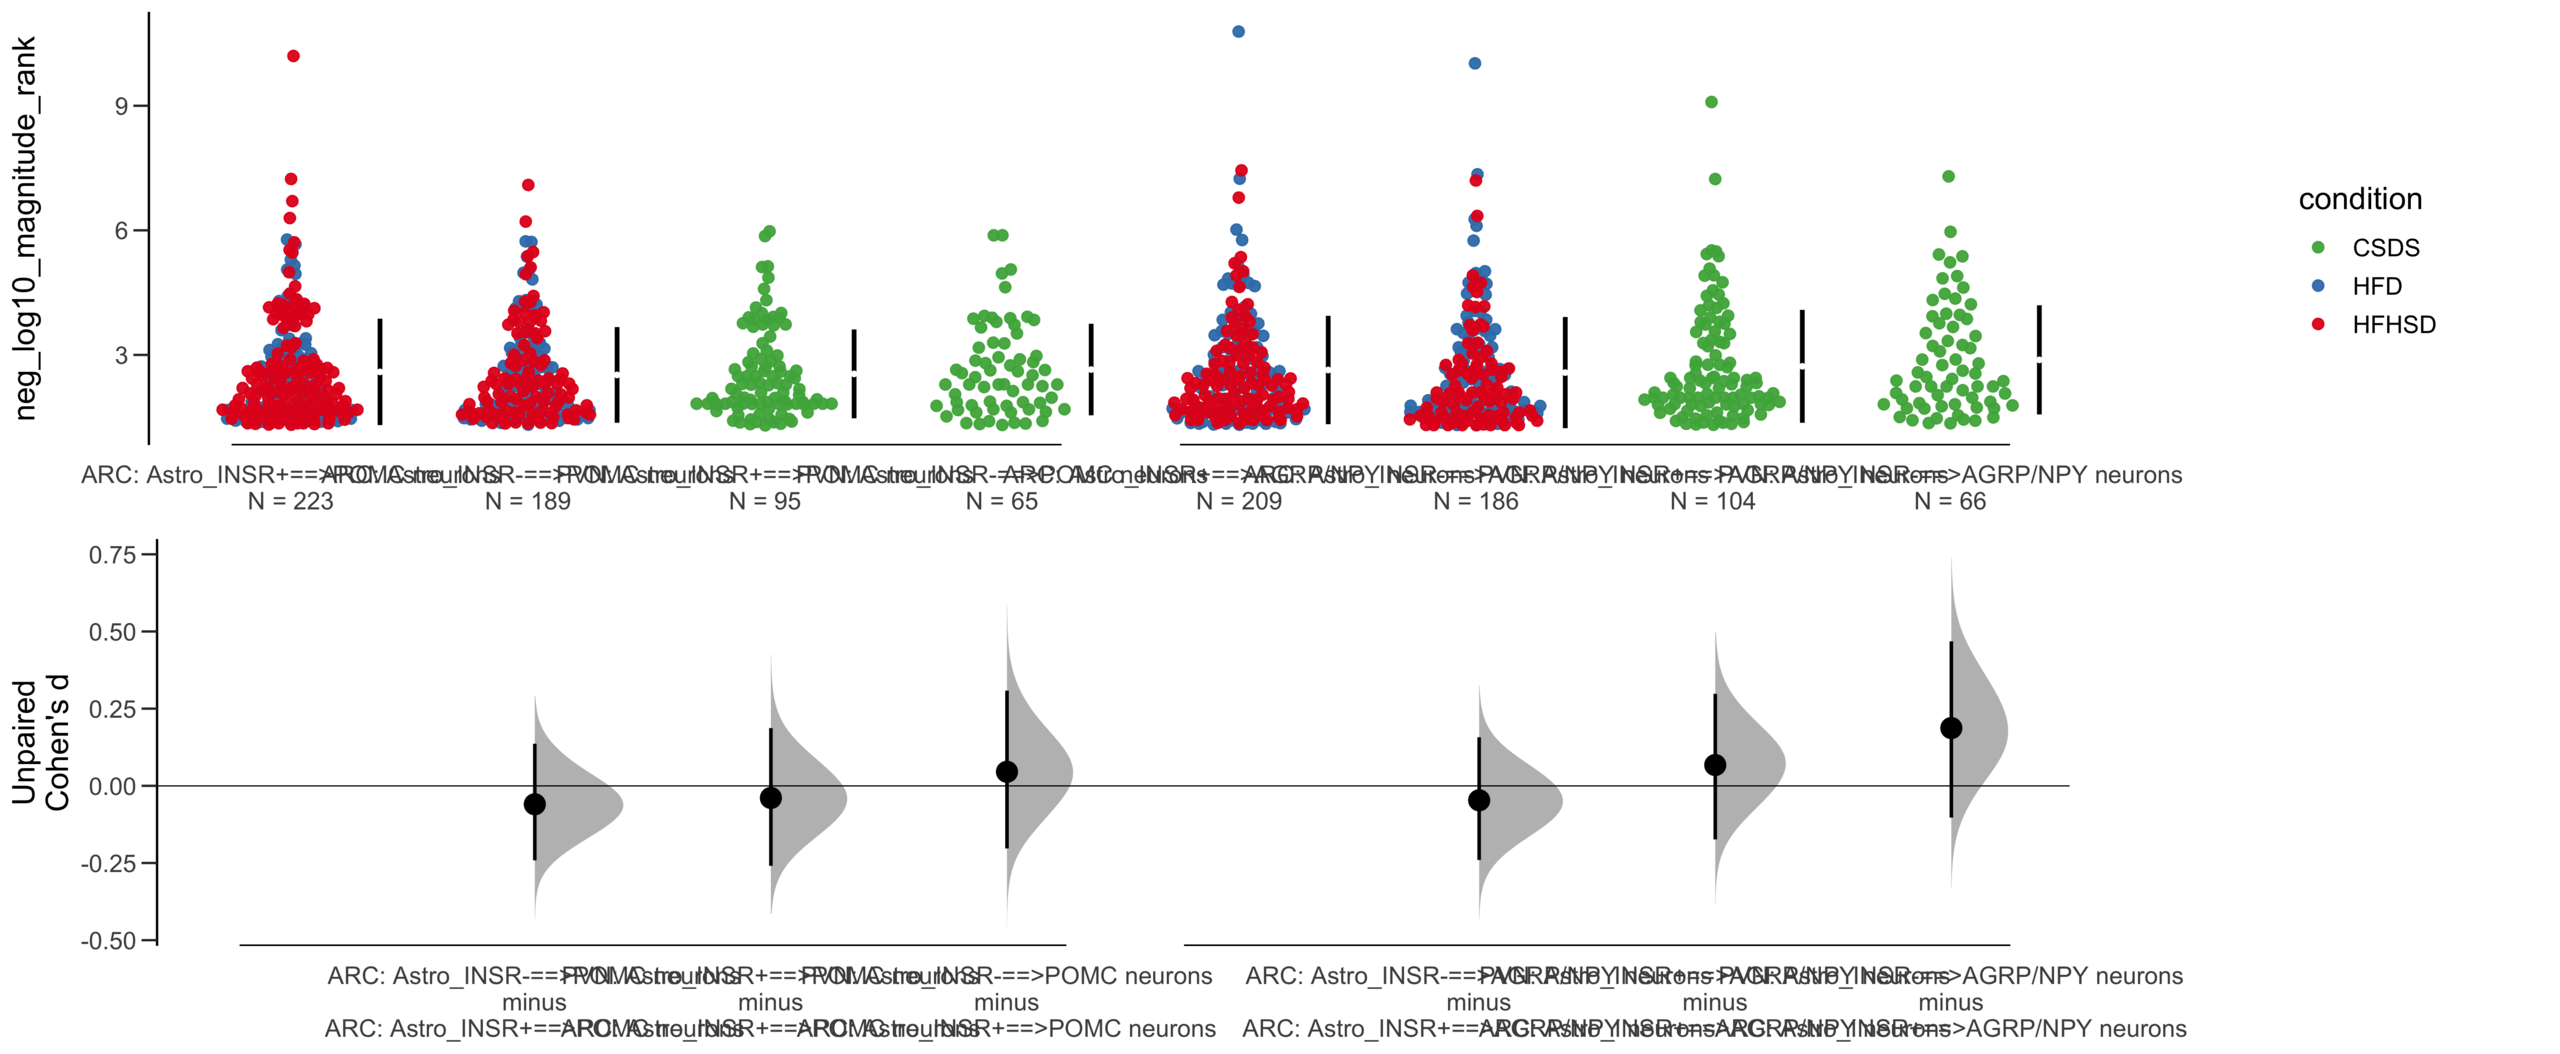
Unpaired mean difference of Astro_INSR-==>POMC neurons (n = 146) minus Astro_INSR+==>POMC neurons (n = 175)
-0.023 [95CI -0.246; 0.198]
5000 bootstrap resamples.
All confidence intervals are bias-corrected and accelerated.
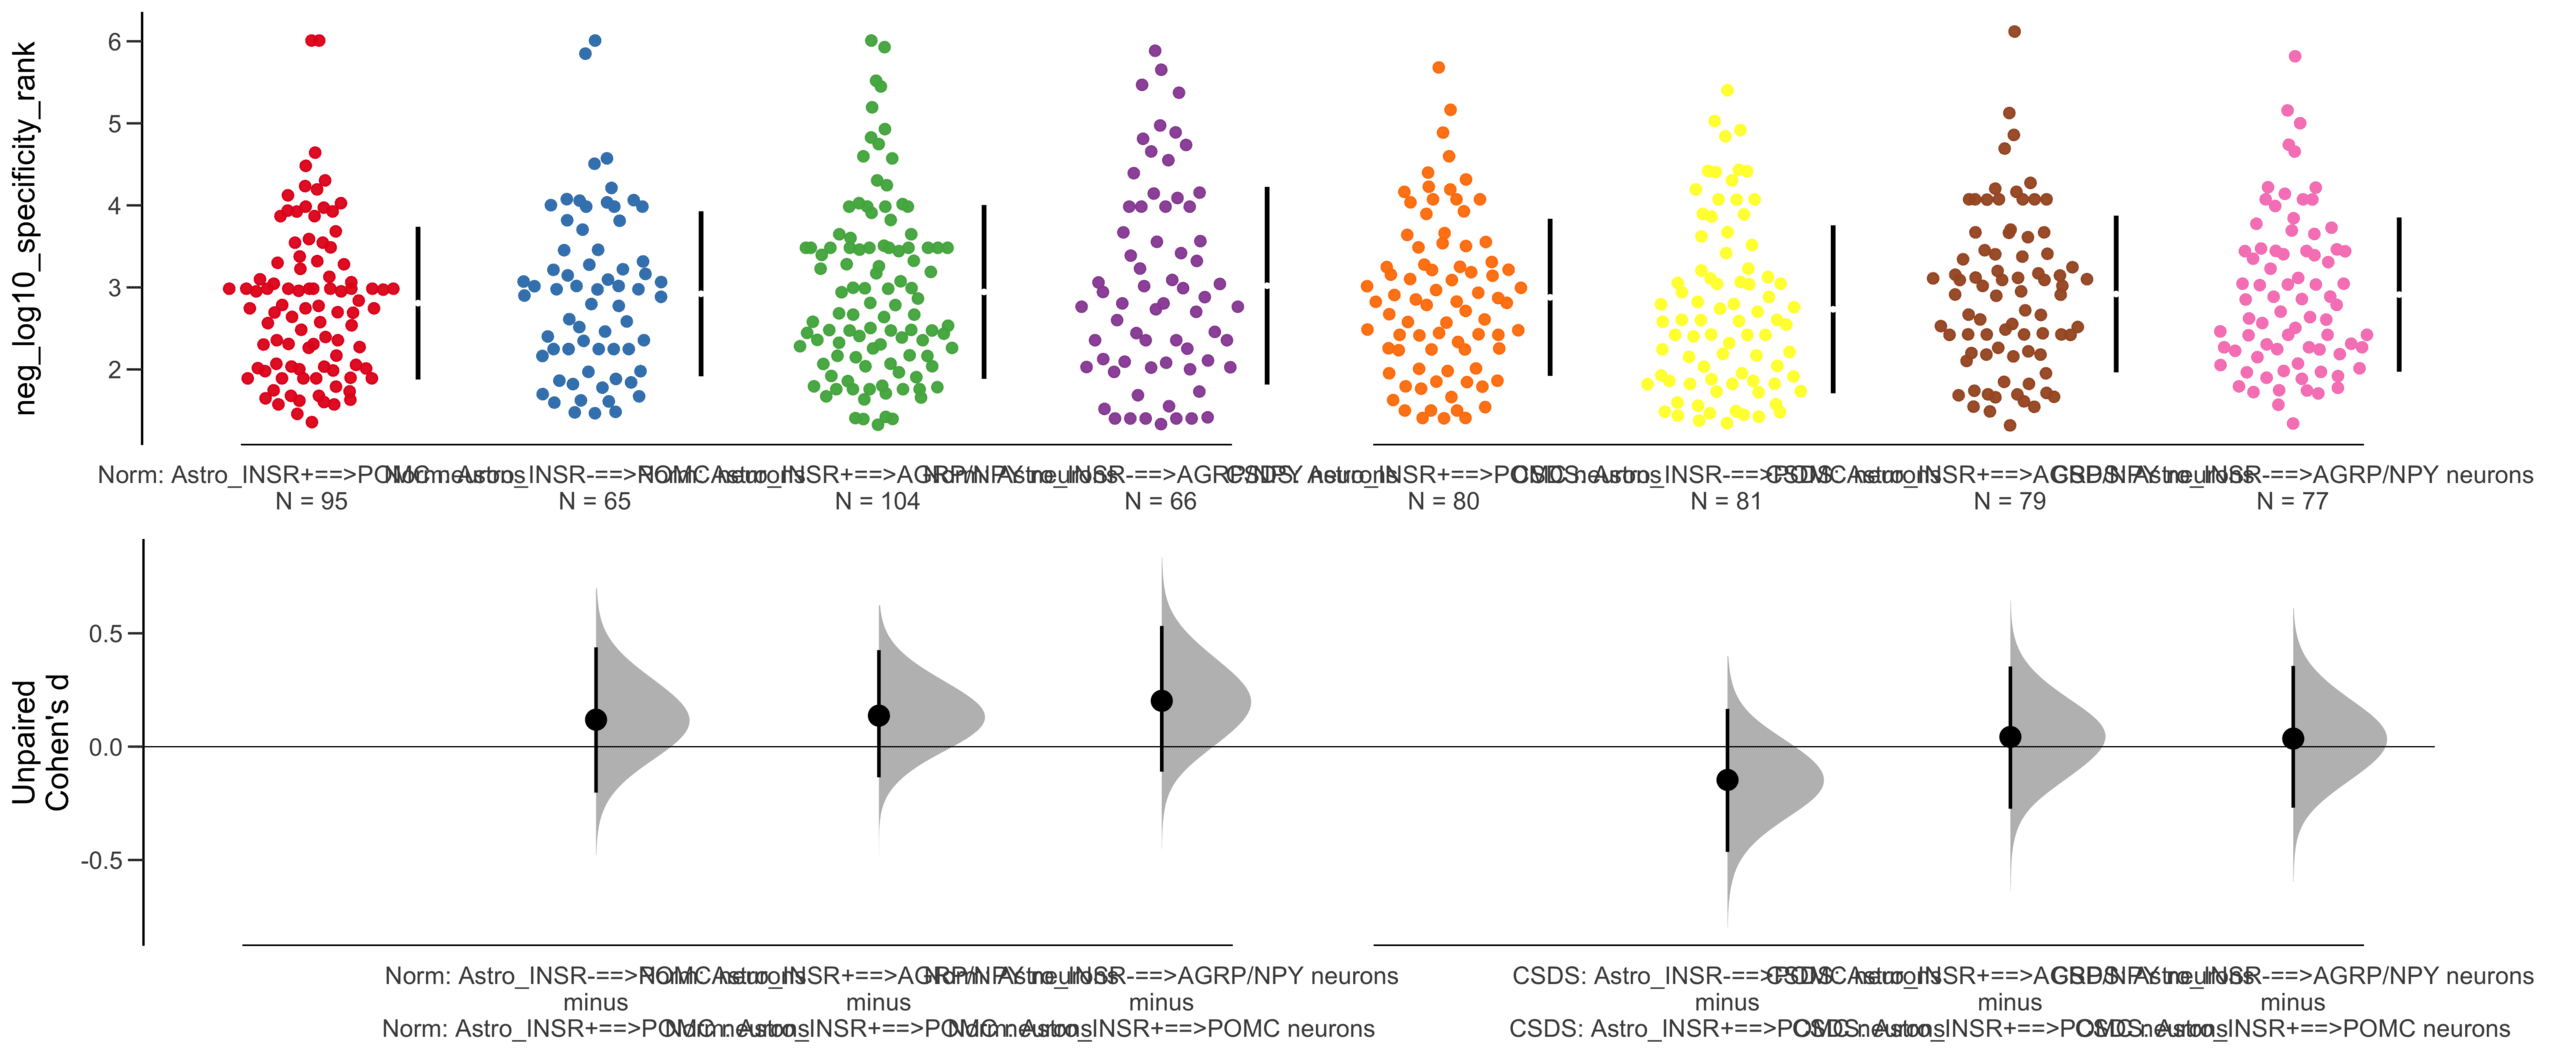
dabestr (Data Analysis with Bootstrap Estimation in R) v0.3.0
=============================================================
Good afternoon!
The current time is 13:40 PM on Saturday July 29, 2023.
Dataset : df.two.group.unpaired
X Variable : pairs
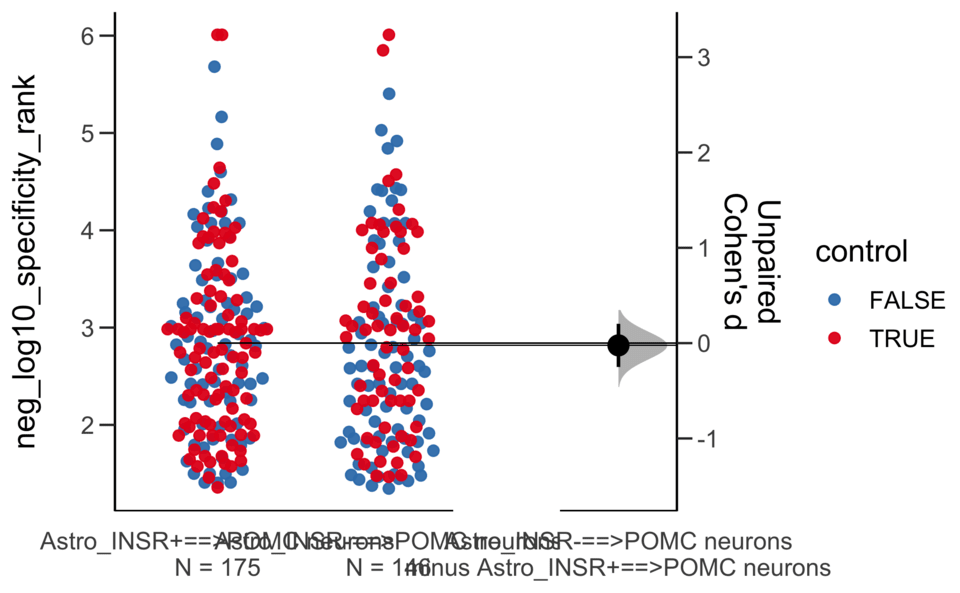
Y Variable : neg_log10_specificity_rank
Unpaired Cohen's d of Astro_INSR-==>POMC neurons (n = 146) minus Astro_INSR+==>POMC neurons (n = 175)
-0.0235 [95CI -0.25; 0.203]
5000 bootstrap resamples.
All confidence intervals are bias-corrected and accelerated.
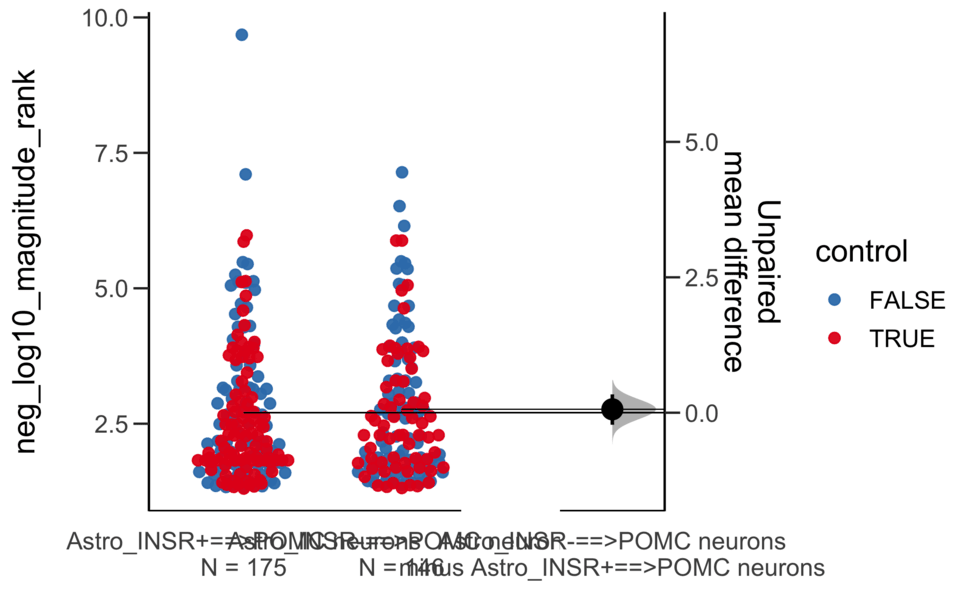
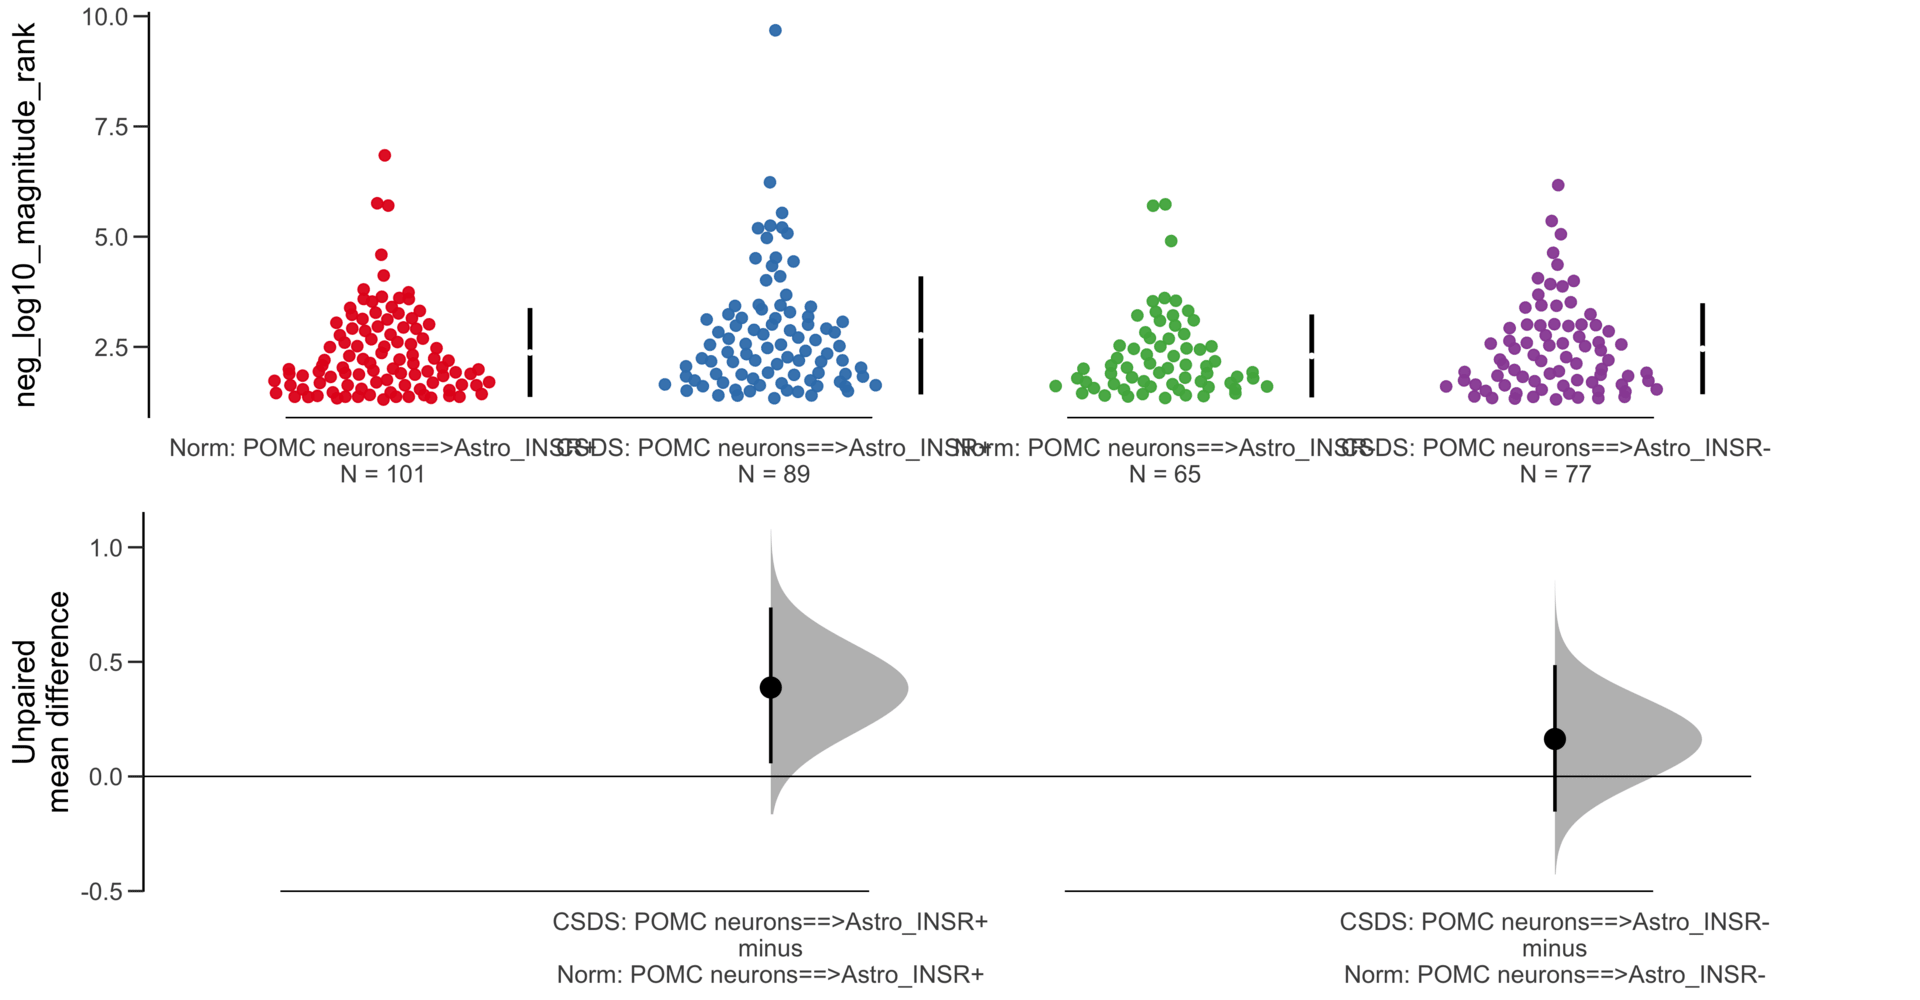
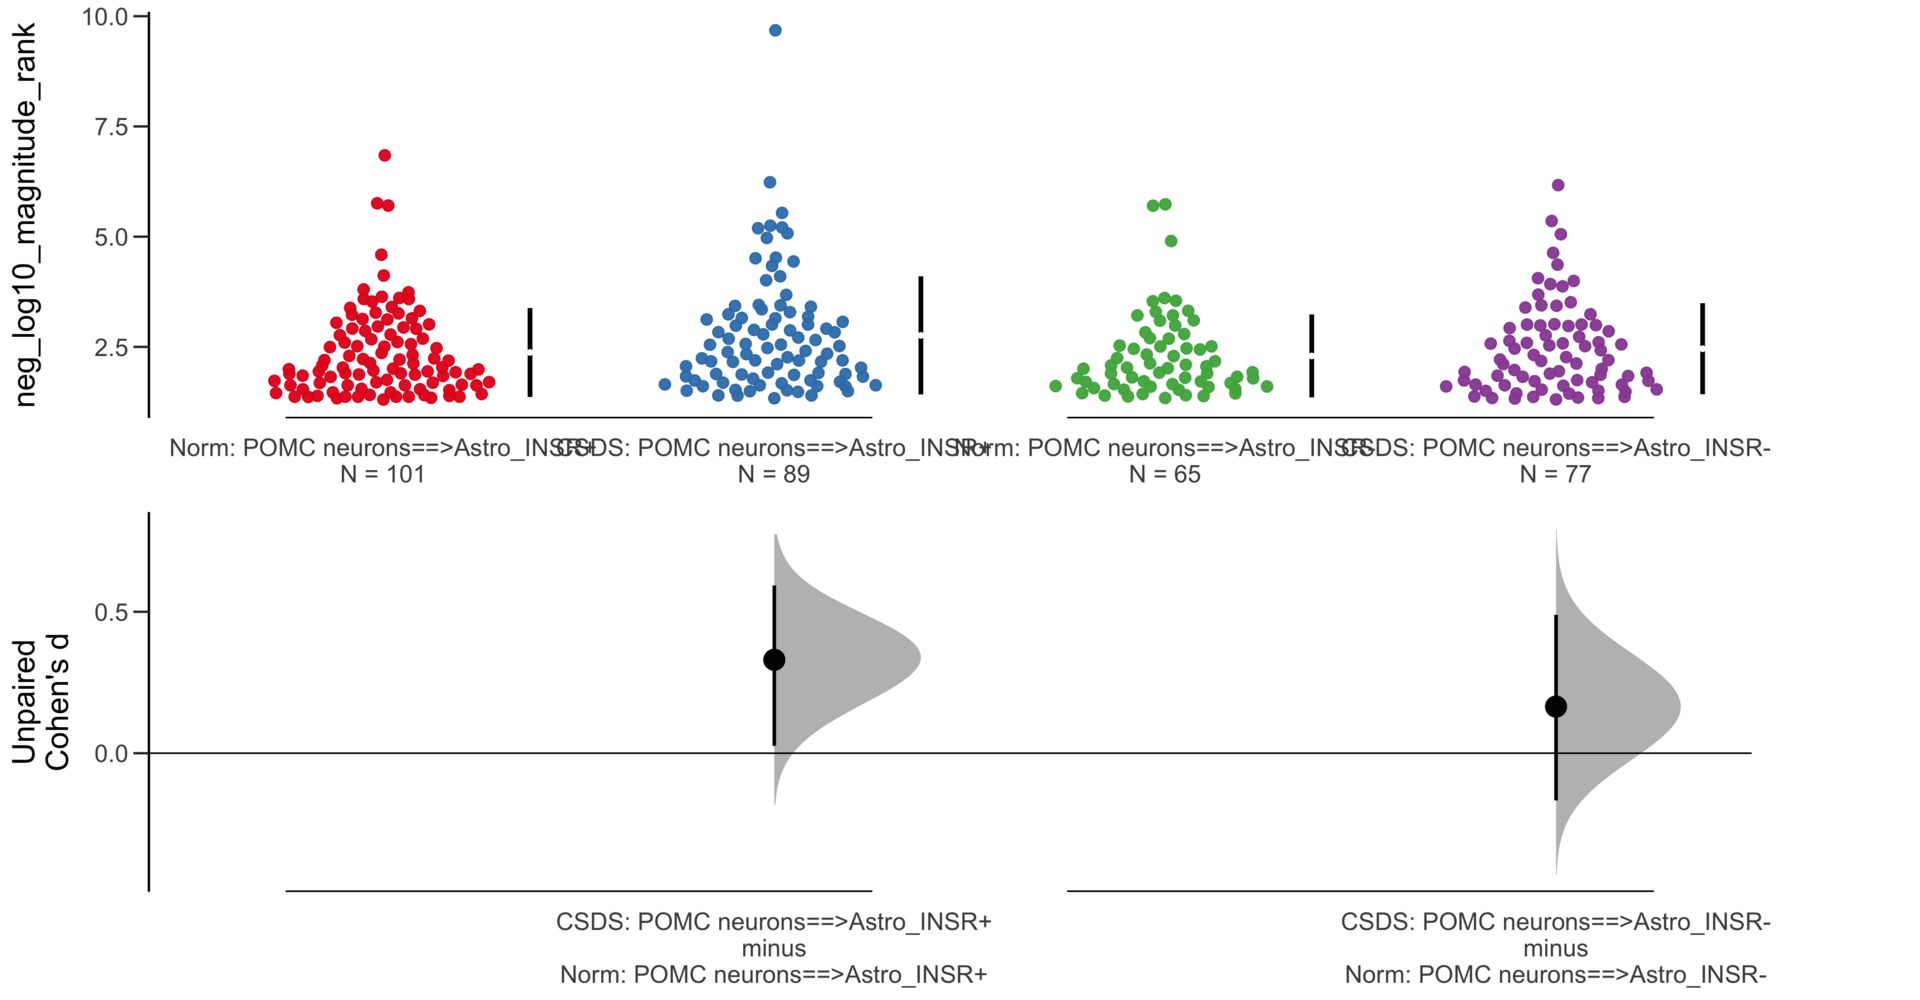
dabestr (Data Analysis with Bootstrap Estimation in R) v0.3.0
=============================================================
Good afternoon!
The current time is 13:41 PM on Saturday July 29, 2023.
Dataset : df.two.group.unpaired
X Variable : pairs
Y Variable : neg_log10_magnitude_rank
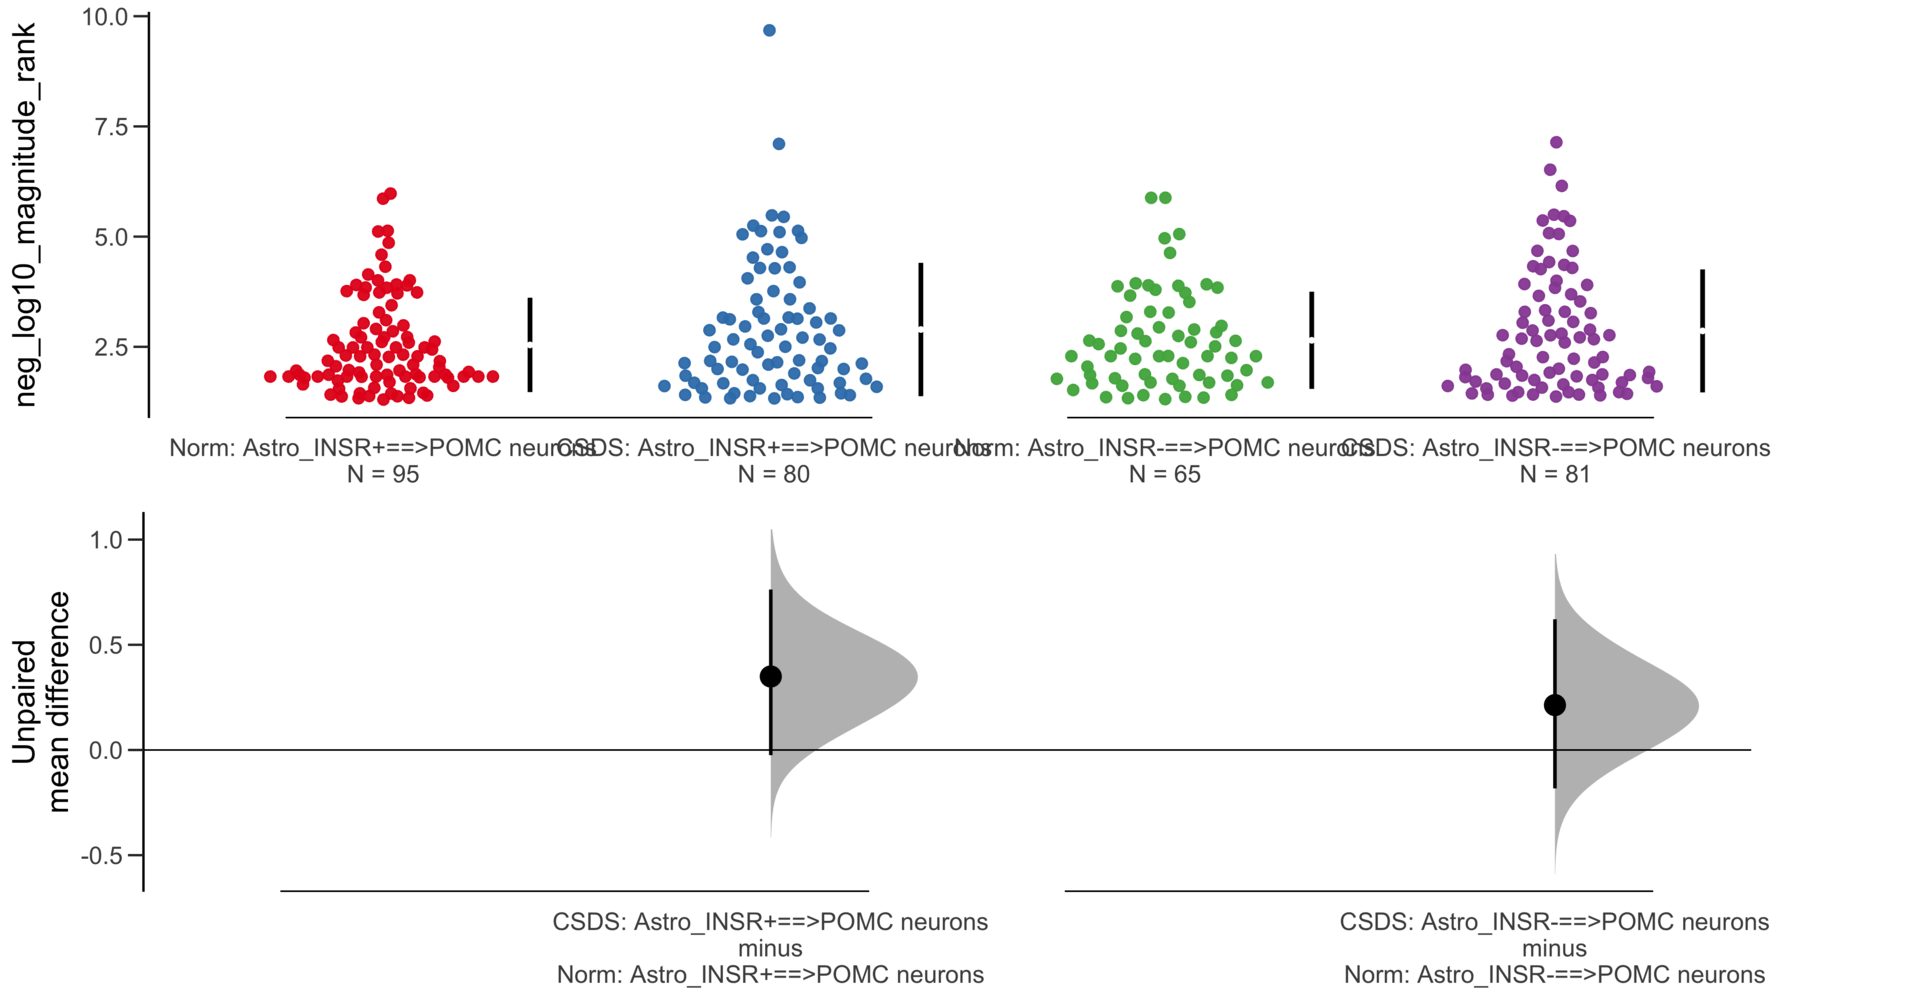
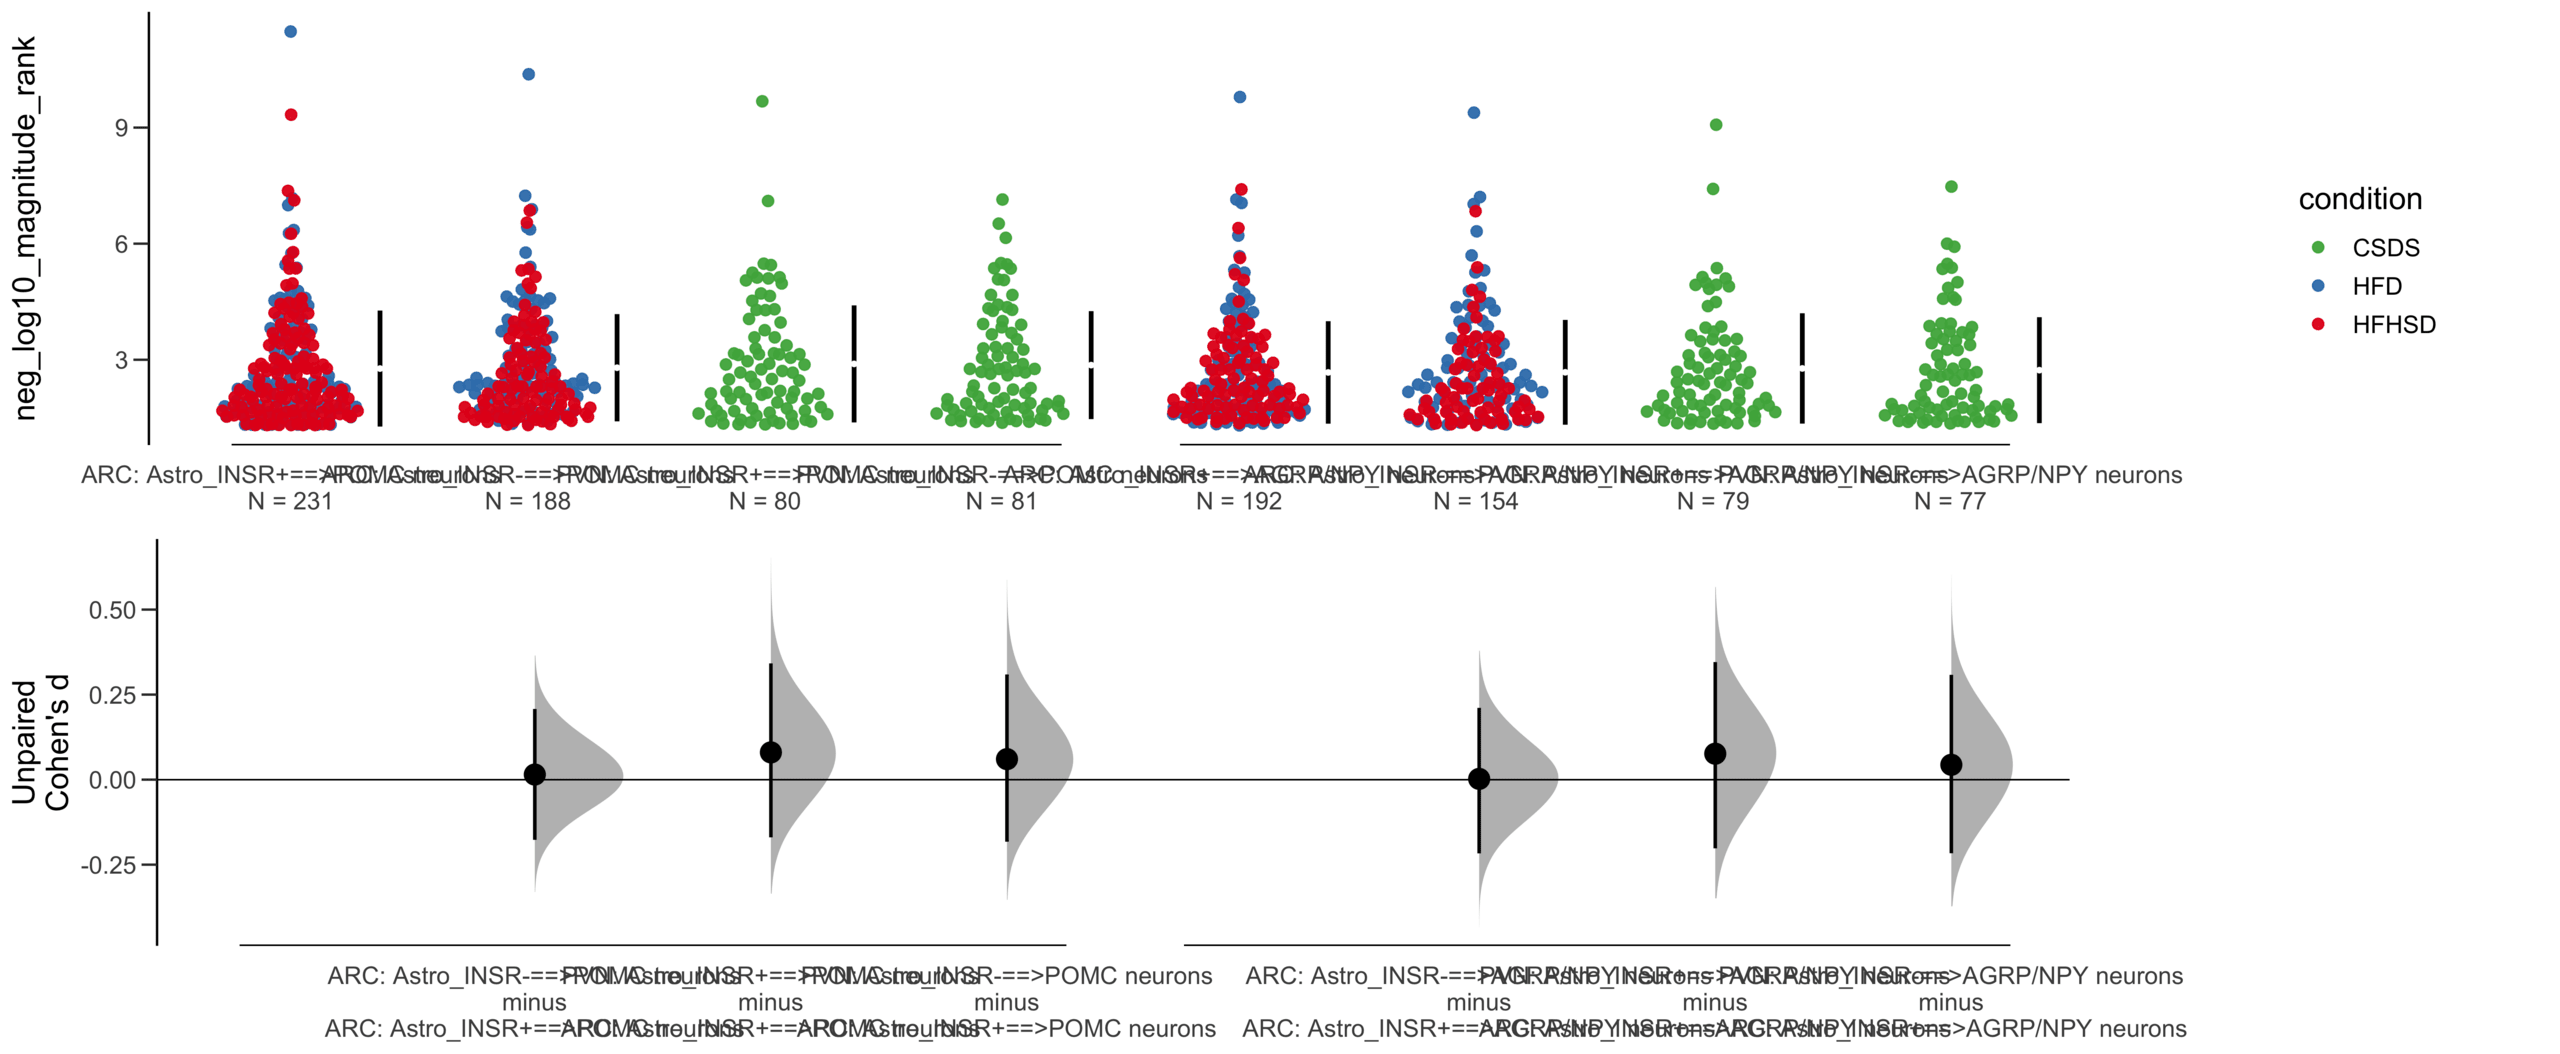
Unpaired mean difference of Astro_INSR-==>POMC neurons (n = 146) minus Astro_INSR+==>POMC neurons (n = 175)
0.0631 [95CI -0.222; 0.338]
5000 bootstrap resamples.
All confidence intervals are bias-corrected and accelerated.
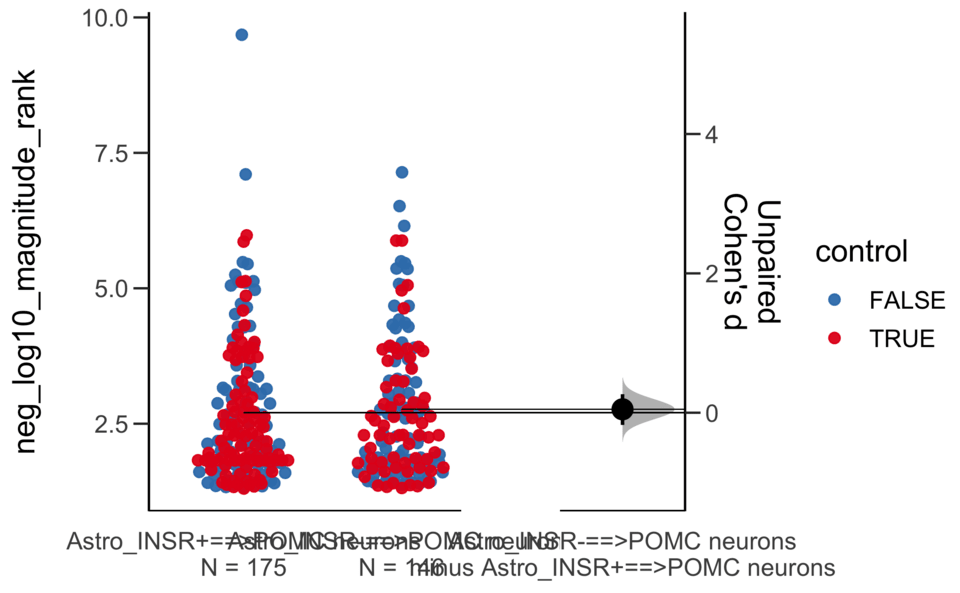
dabestr (Data Analysis with Bootstrap Estimation in R) v0.3.0
=============================================================

Good afternoon!
The current time is 13:41 PM on Saturday July 29, 2023.

Dataset    :  df.two.group.unpaired
X Variable :  pairs
Y Variable :  neg_log10_magnitude_rank

Unpaired Cohen's d of Astro_INSR-==>POMC neurons (n = 146) minus Astro_INSR+==>POMC neurons (n = 175)
 0.0491 [95CI  -0.175; 0.265]


5000 bootstrap resamples.
All confidence intervals are bias-corrected and accelerated.
dabestr (Data Analysis with Bootstrap Estimation in R) v0.3.0
=============================================================
Good afternoon!
The current time is 13:41 PM on Saturday July 29, 2023.
Dataset : df.two.group.unpaired
X Variable : pairs
Y Variable : neg_log10_specificity_rank
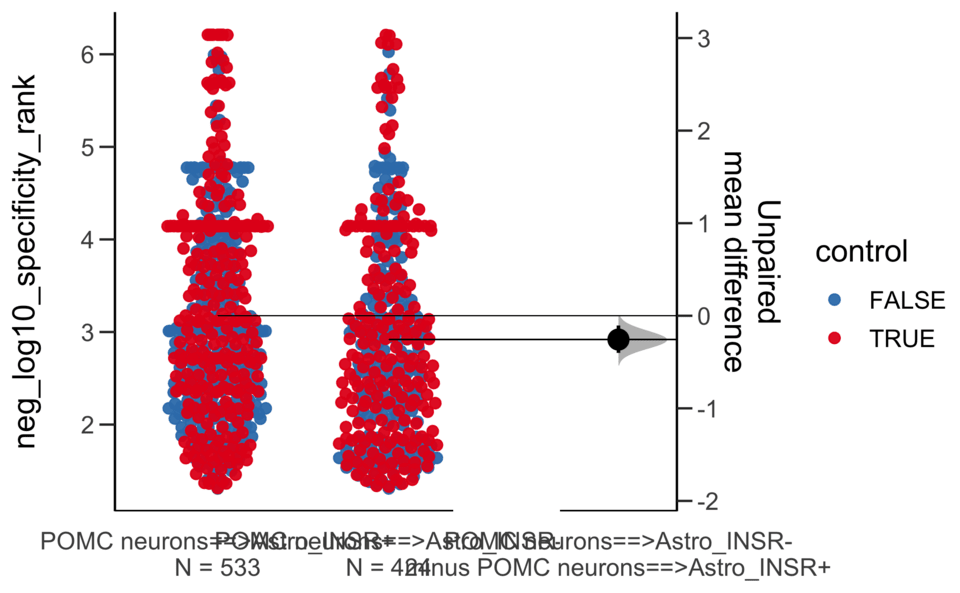
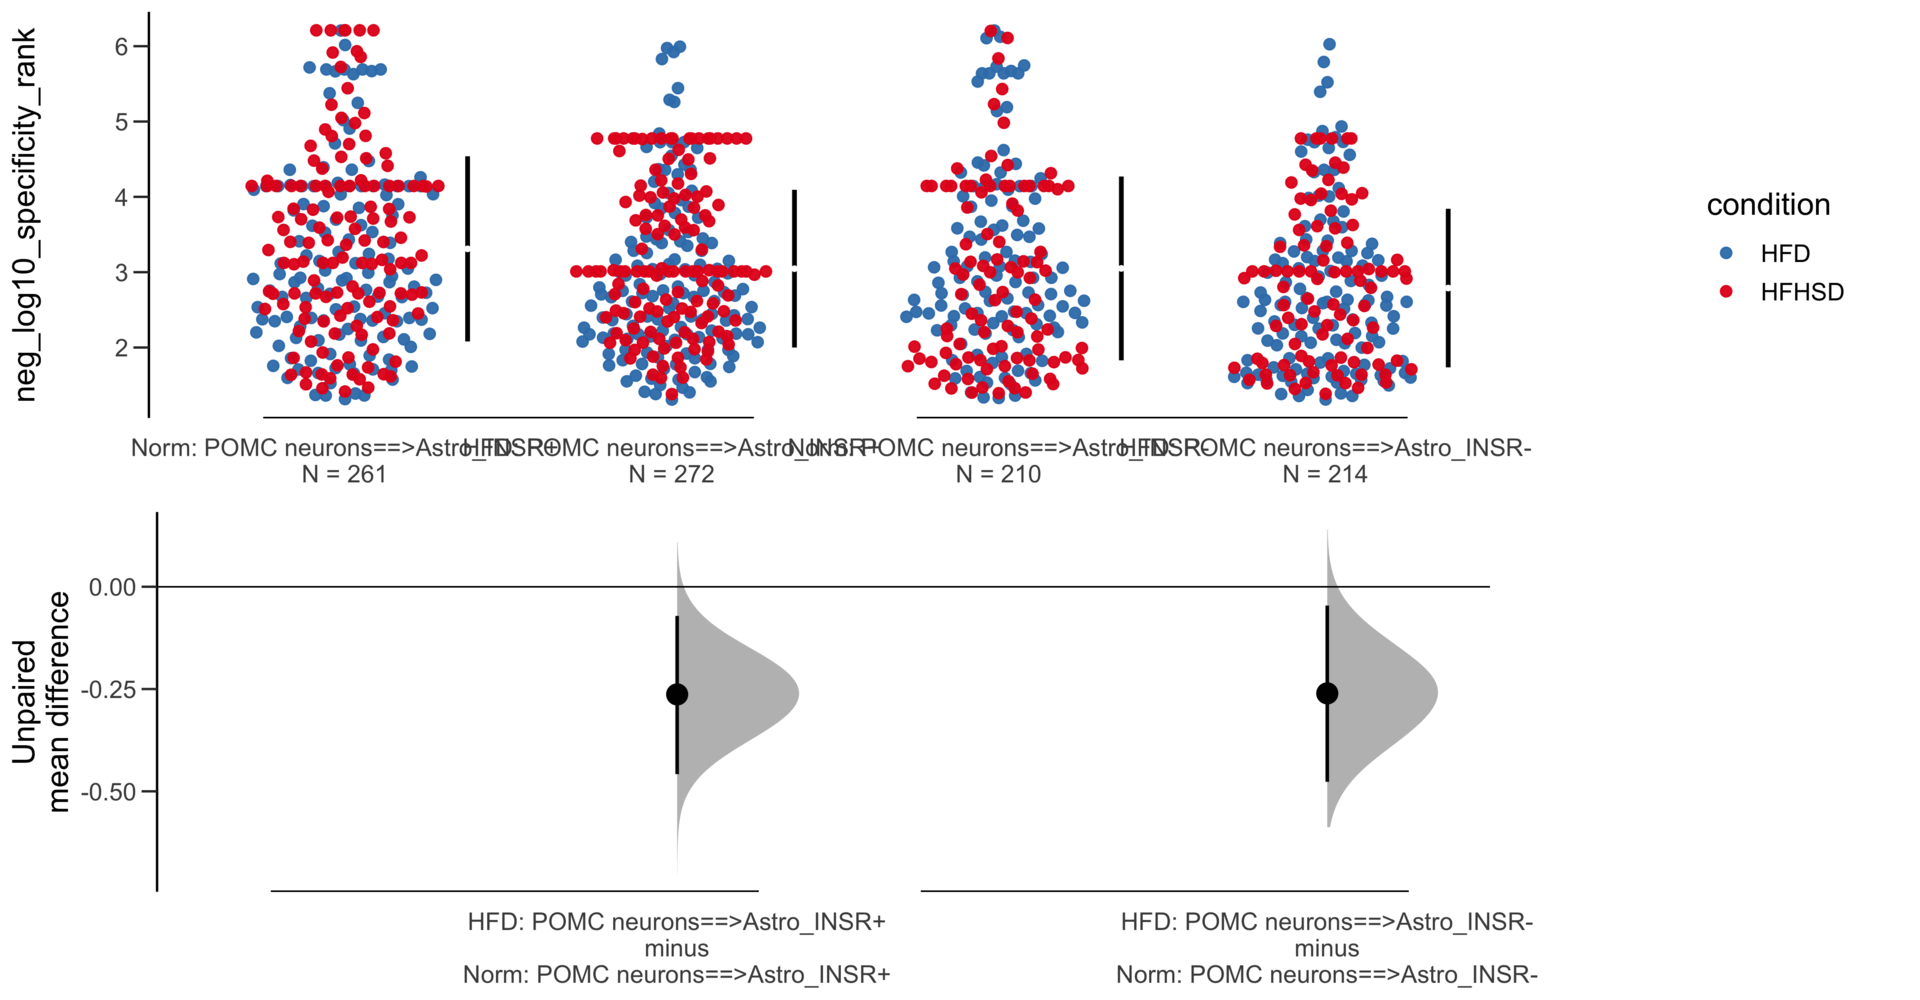
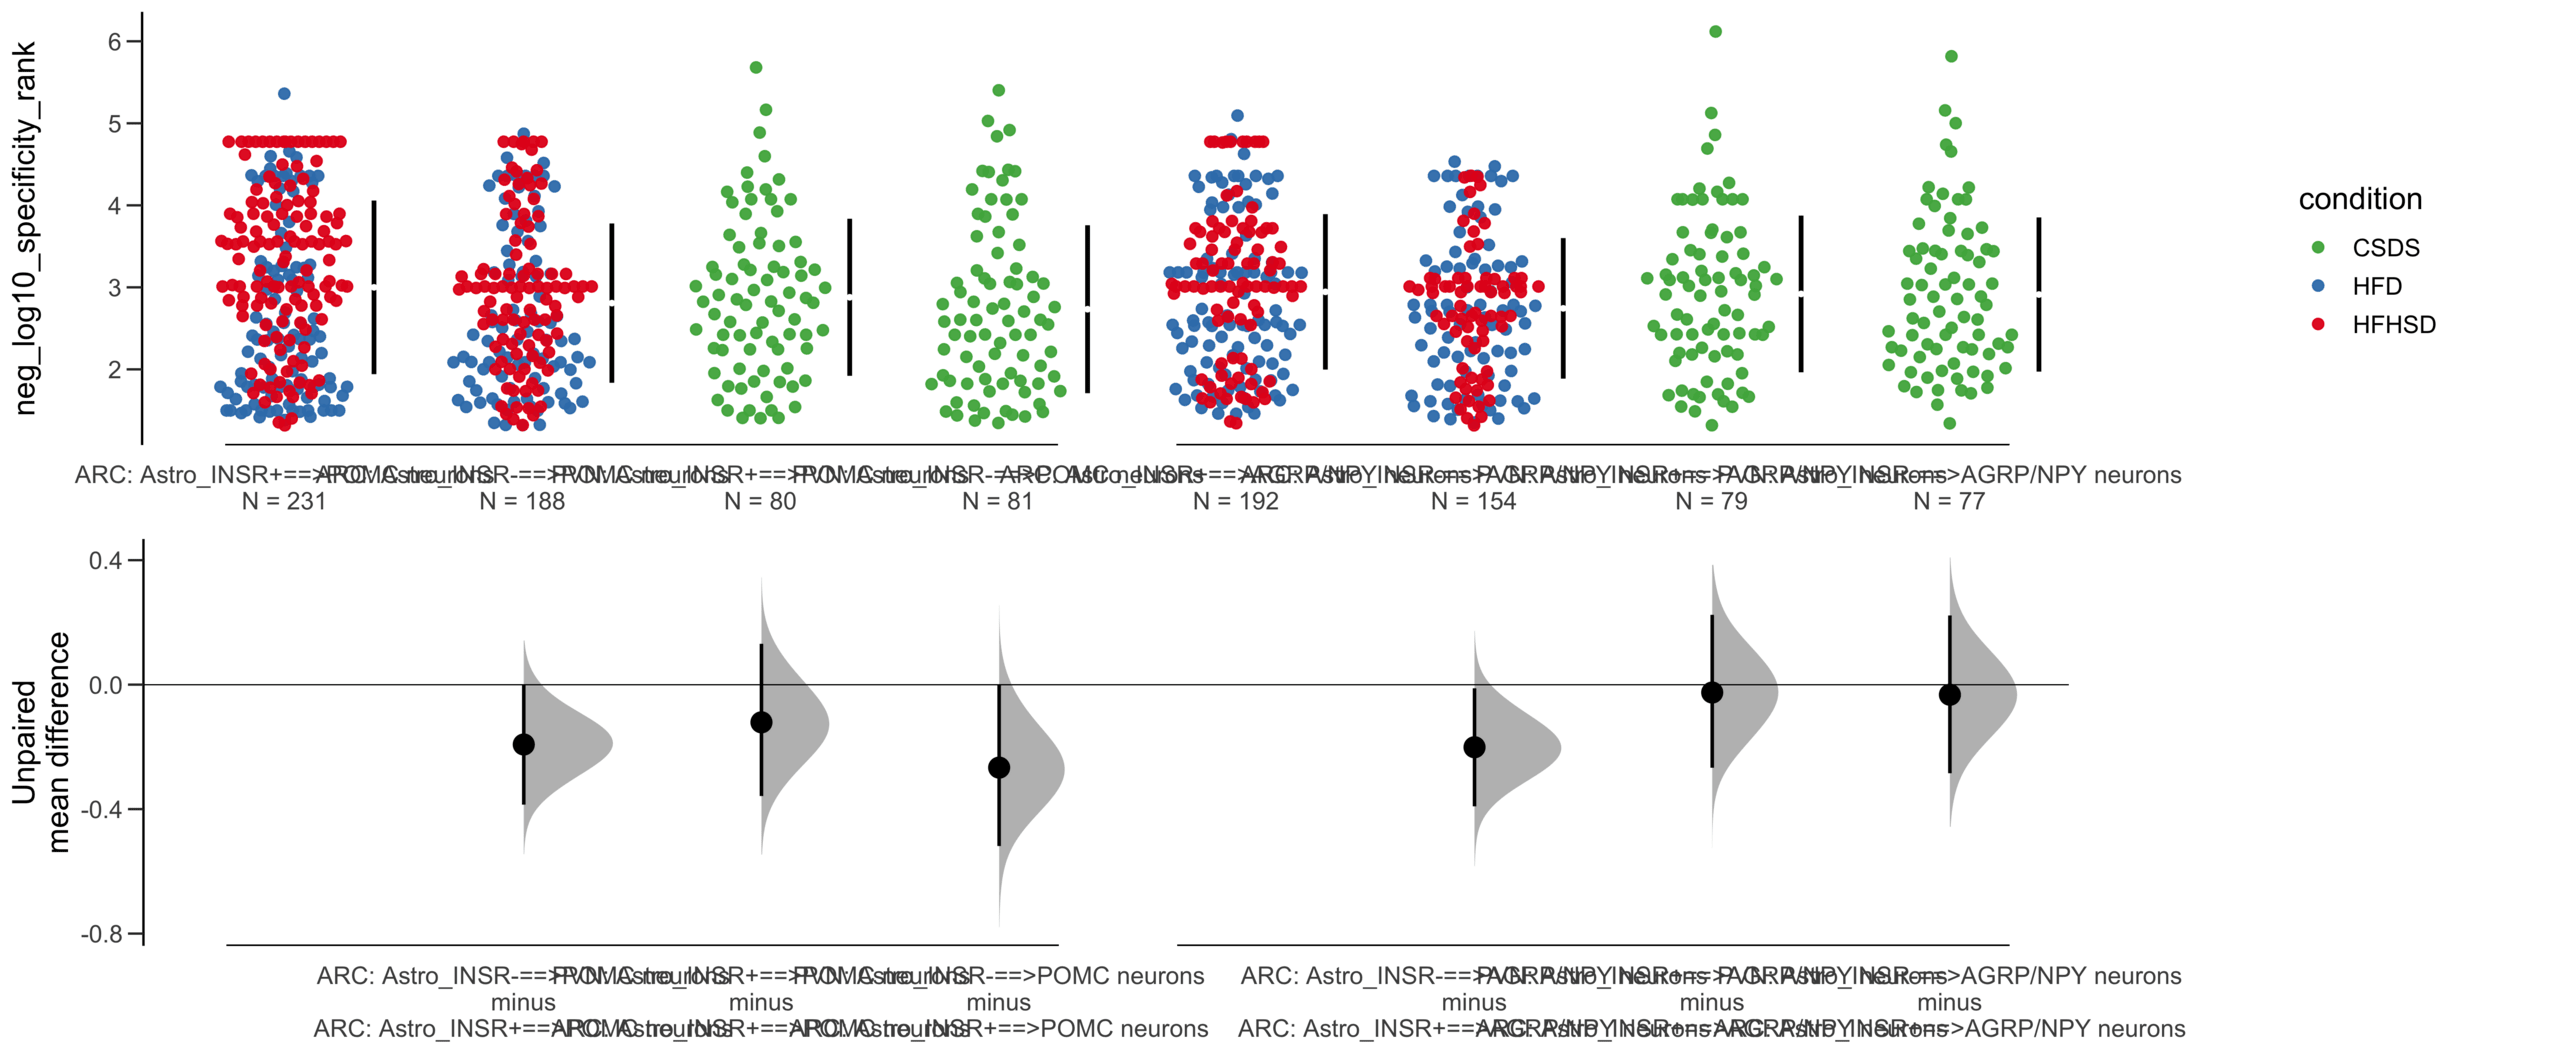
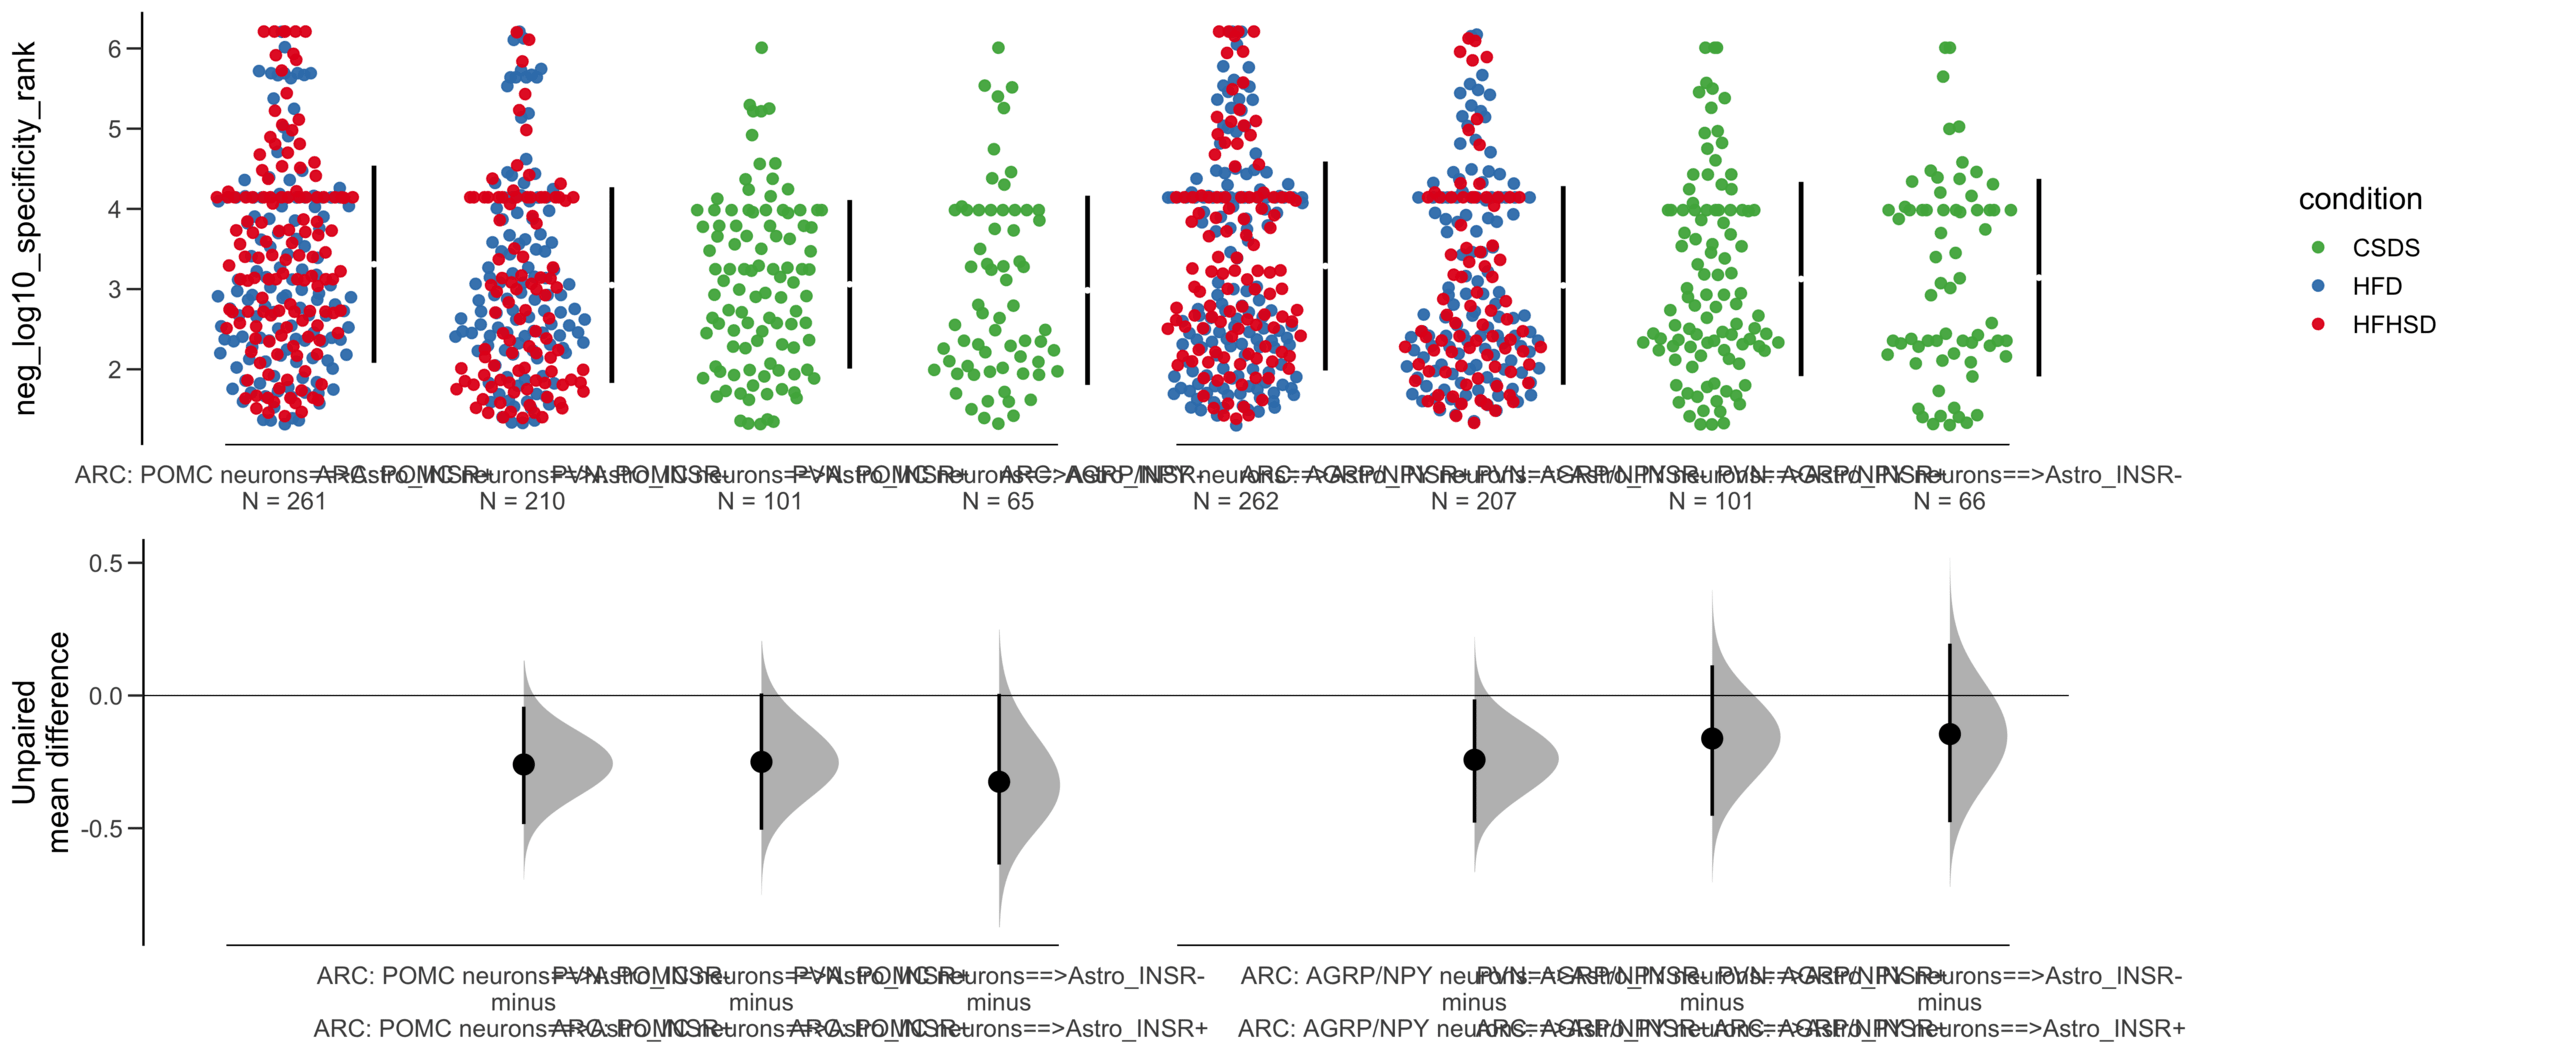
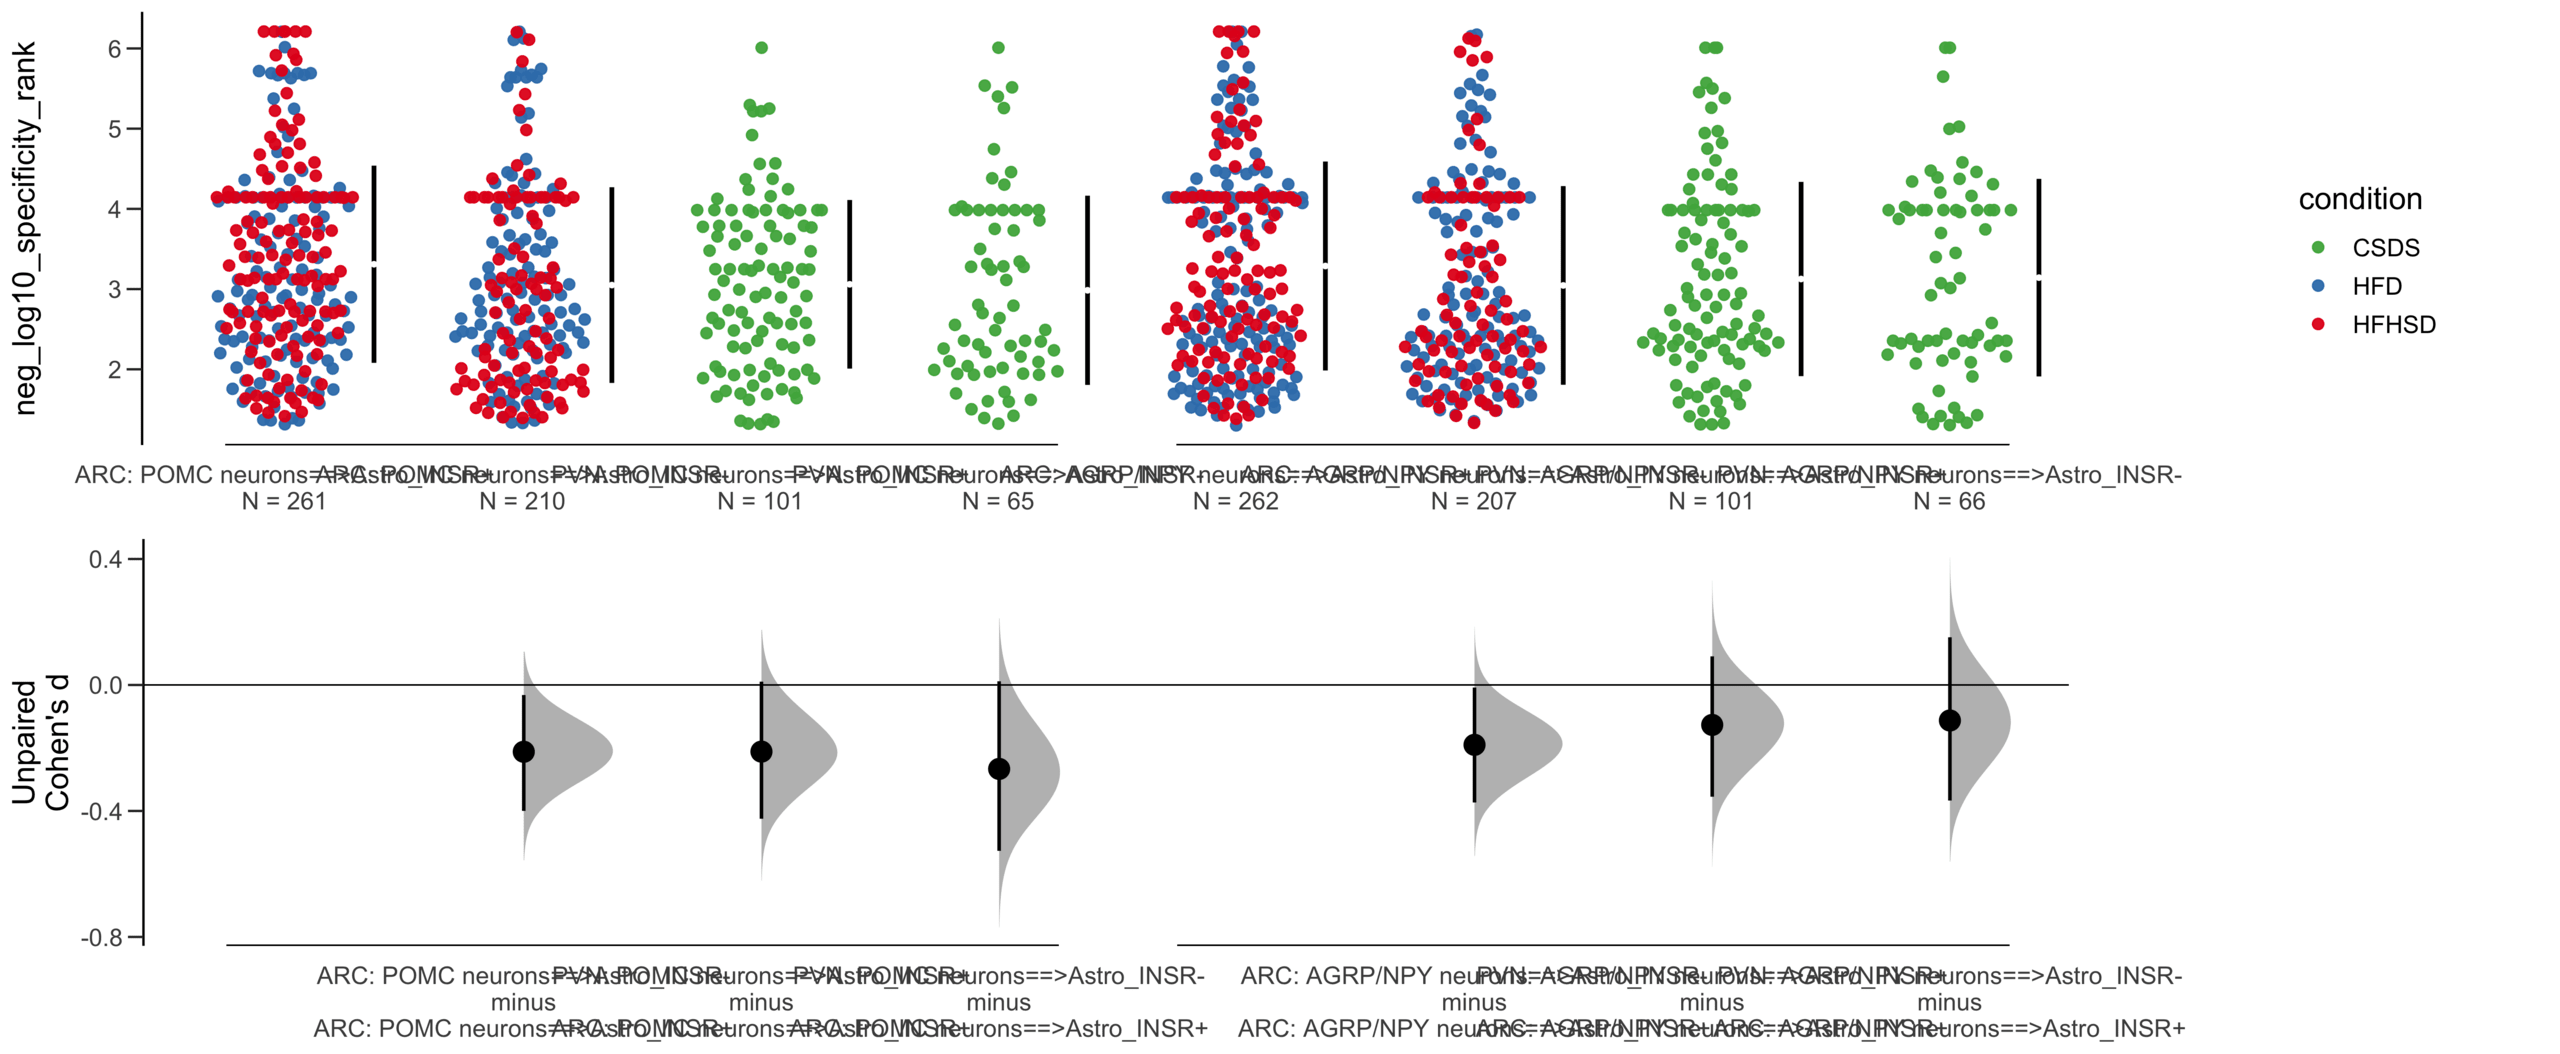
Unpaired mean difference of POMC neurons==>Astro_INSR- (n = 424) minus POMC neurons==>Astro_INSR+ (n = 533)
-0.257 [95CI -0.401; -0.105]
5000 bootstrap resamples.
All confidence intervals are bias-corrected and accelerated.
dabestr (Data Analysis with Bootstrap Estimation in R) v0.3.0
=============================================================
Good afternoon!
The current time is 13:41 PM on Saturday July 29, 2023.
Dataset : df.two.group.unpaired
X Variable : pairs
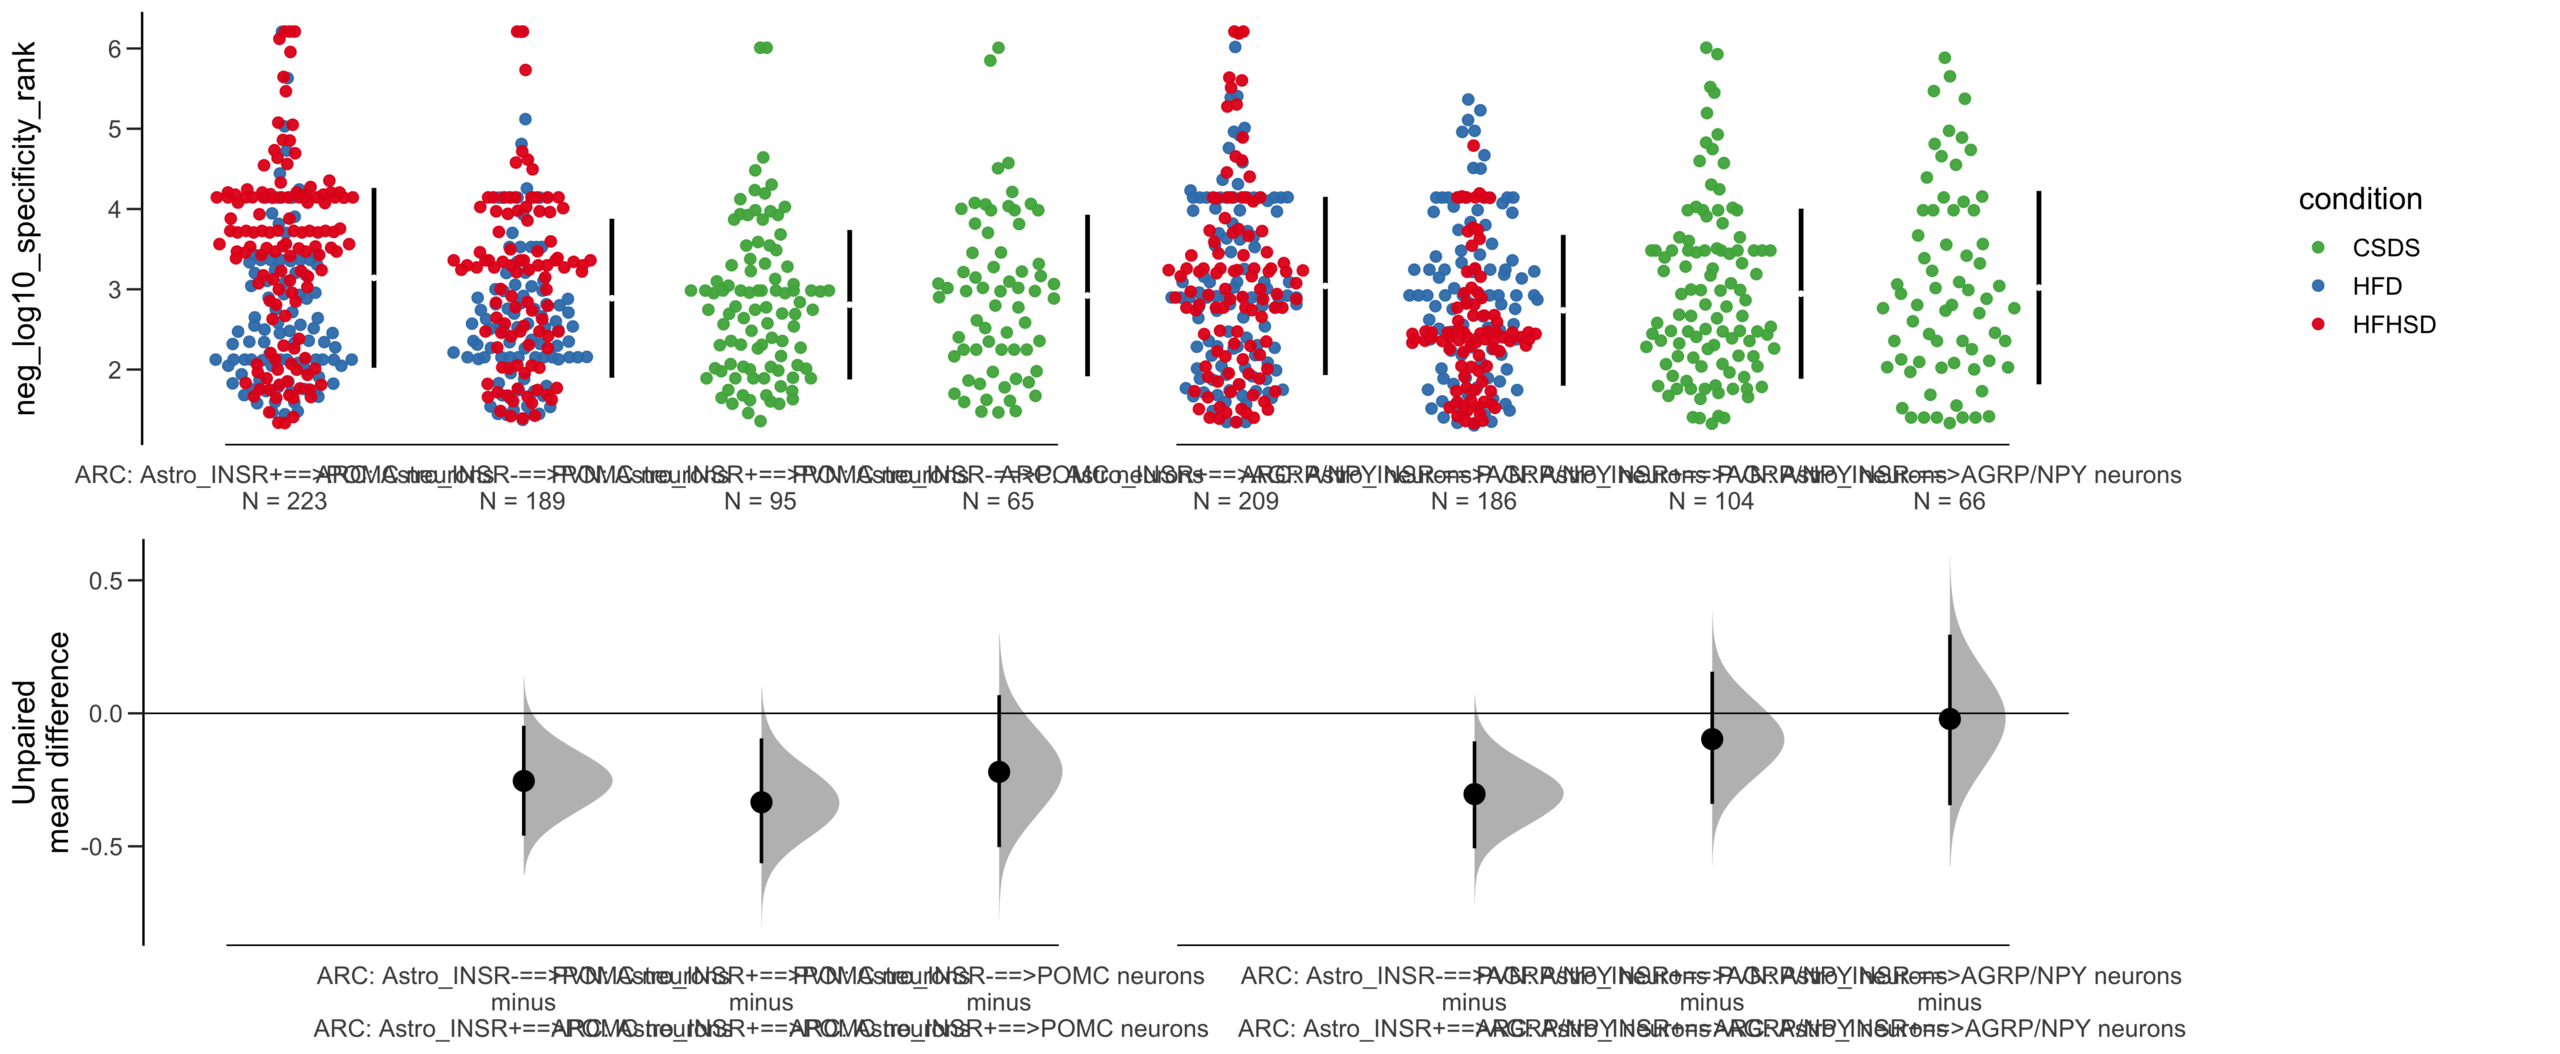
Y Variable : neg_log10_specificity_rank
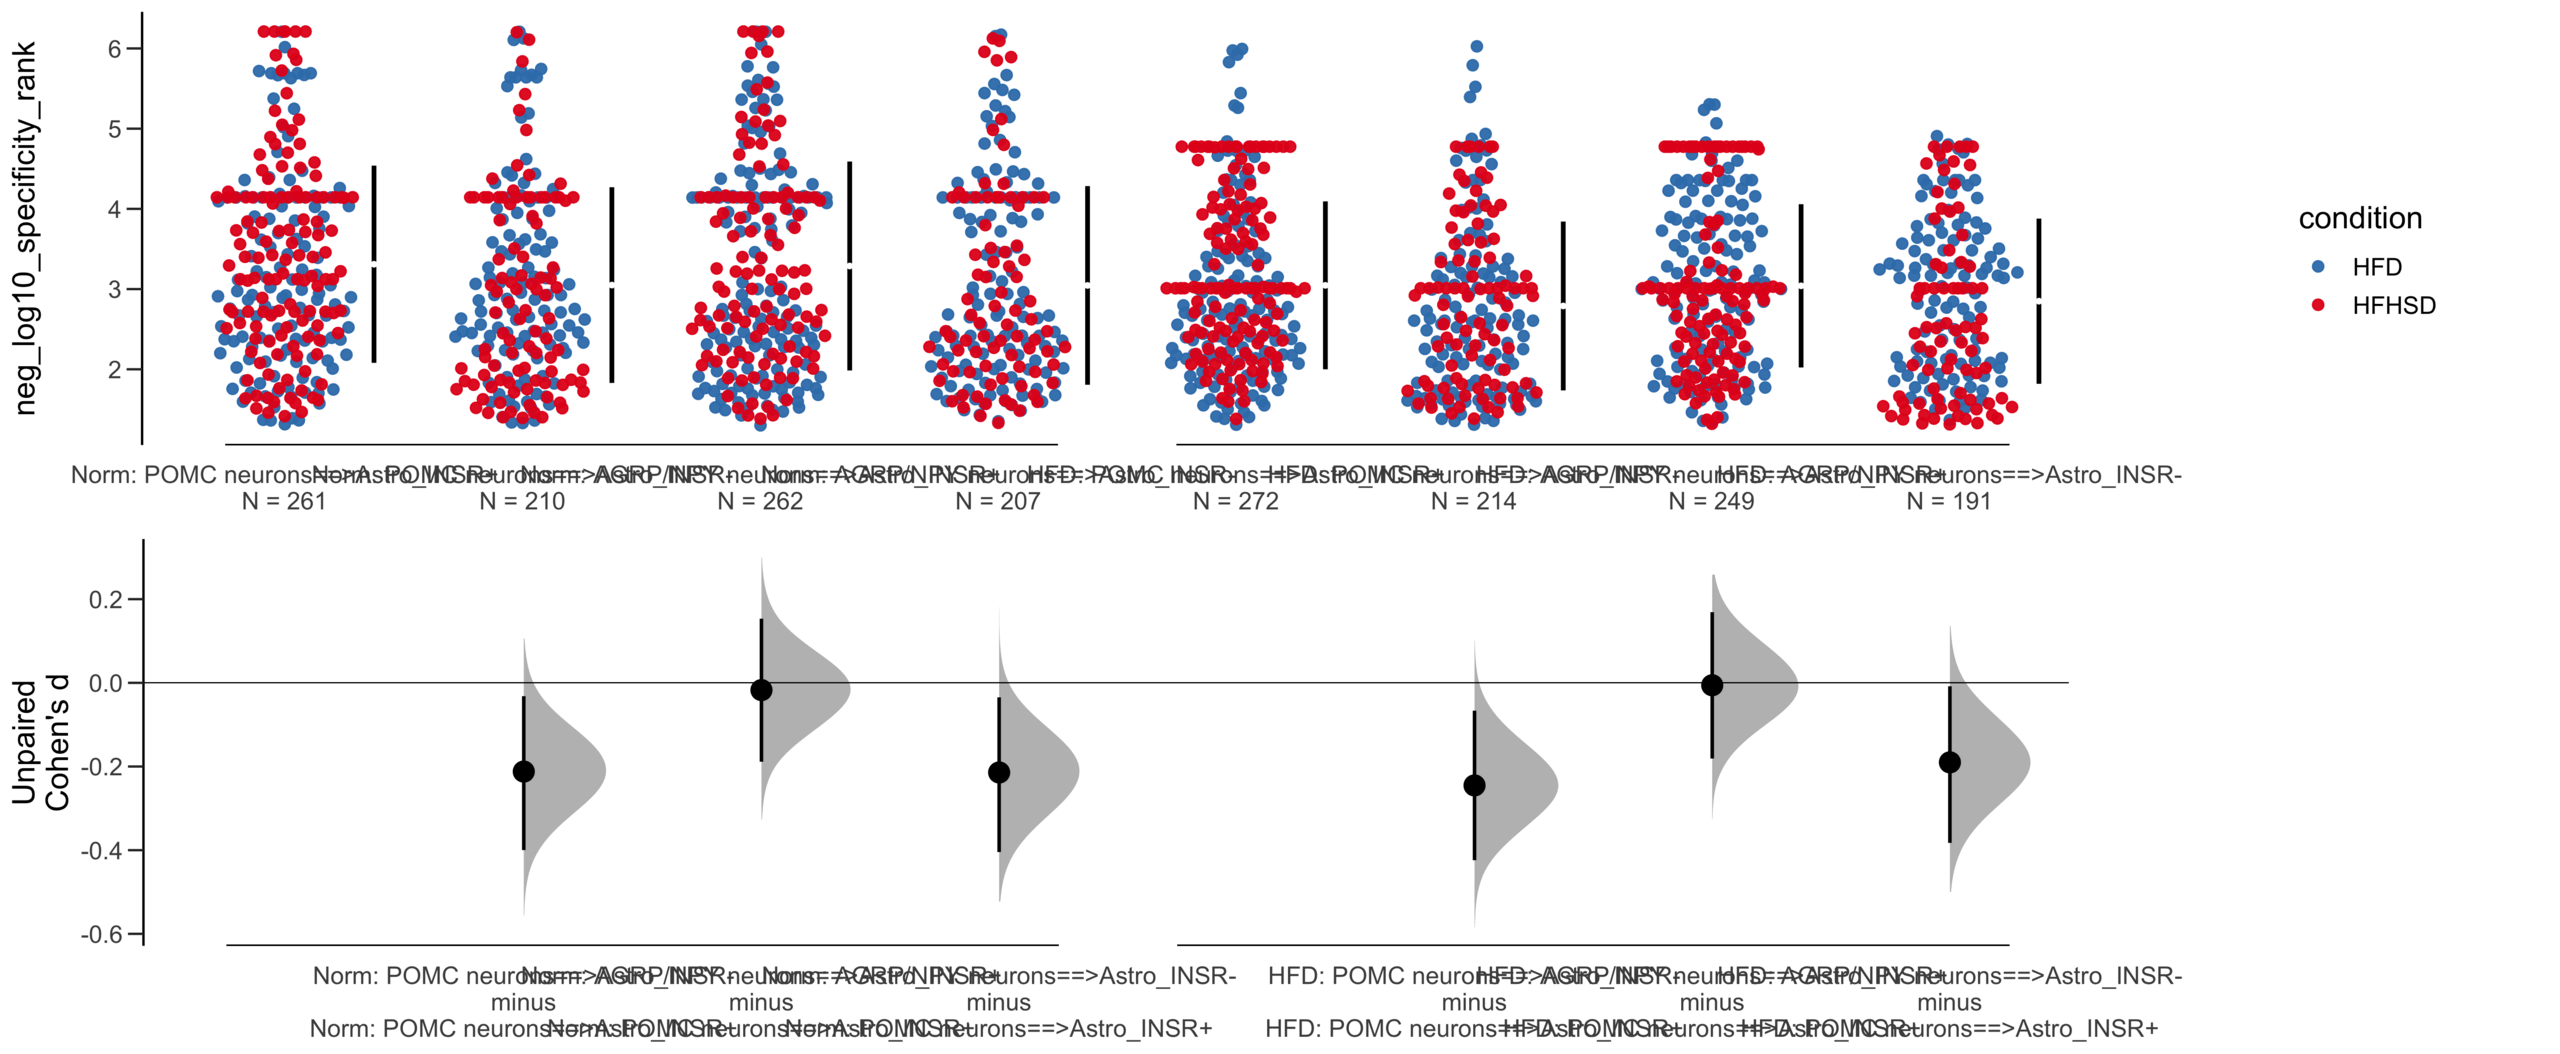
Unpaired Cohen's d of POMC neurons==>Astro_INSR- (n = 424) minus POMC neurons==>Astro_INSR+ (n = 533)
-0.224 [95CI -0.35; -0.0902]
5000 bootstrap resamples.
All confidence intervals are bias-corrected and accelerated.
dabestr (Data Analysis with Bootstrap Estimation in R) v0.3.0
=============================================================
Good afternoon!
The current time is 13:42 PM on Saturday July 29, 2023.
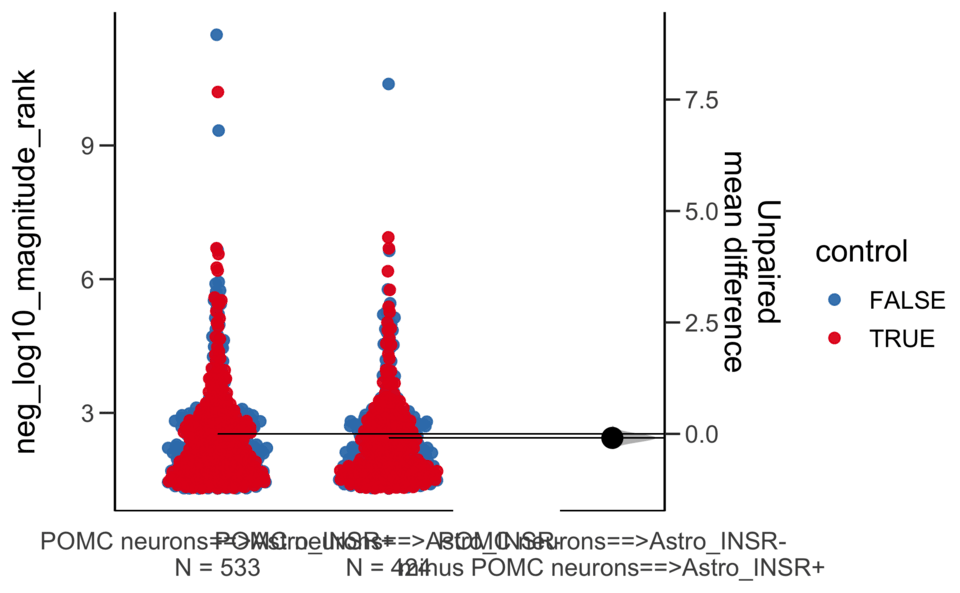
Dataset : df.two.group.unpaired
X Variable : pairs
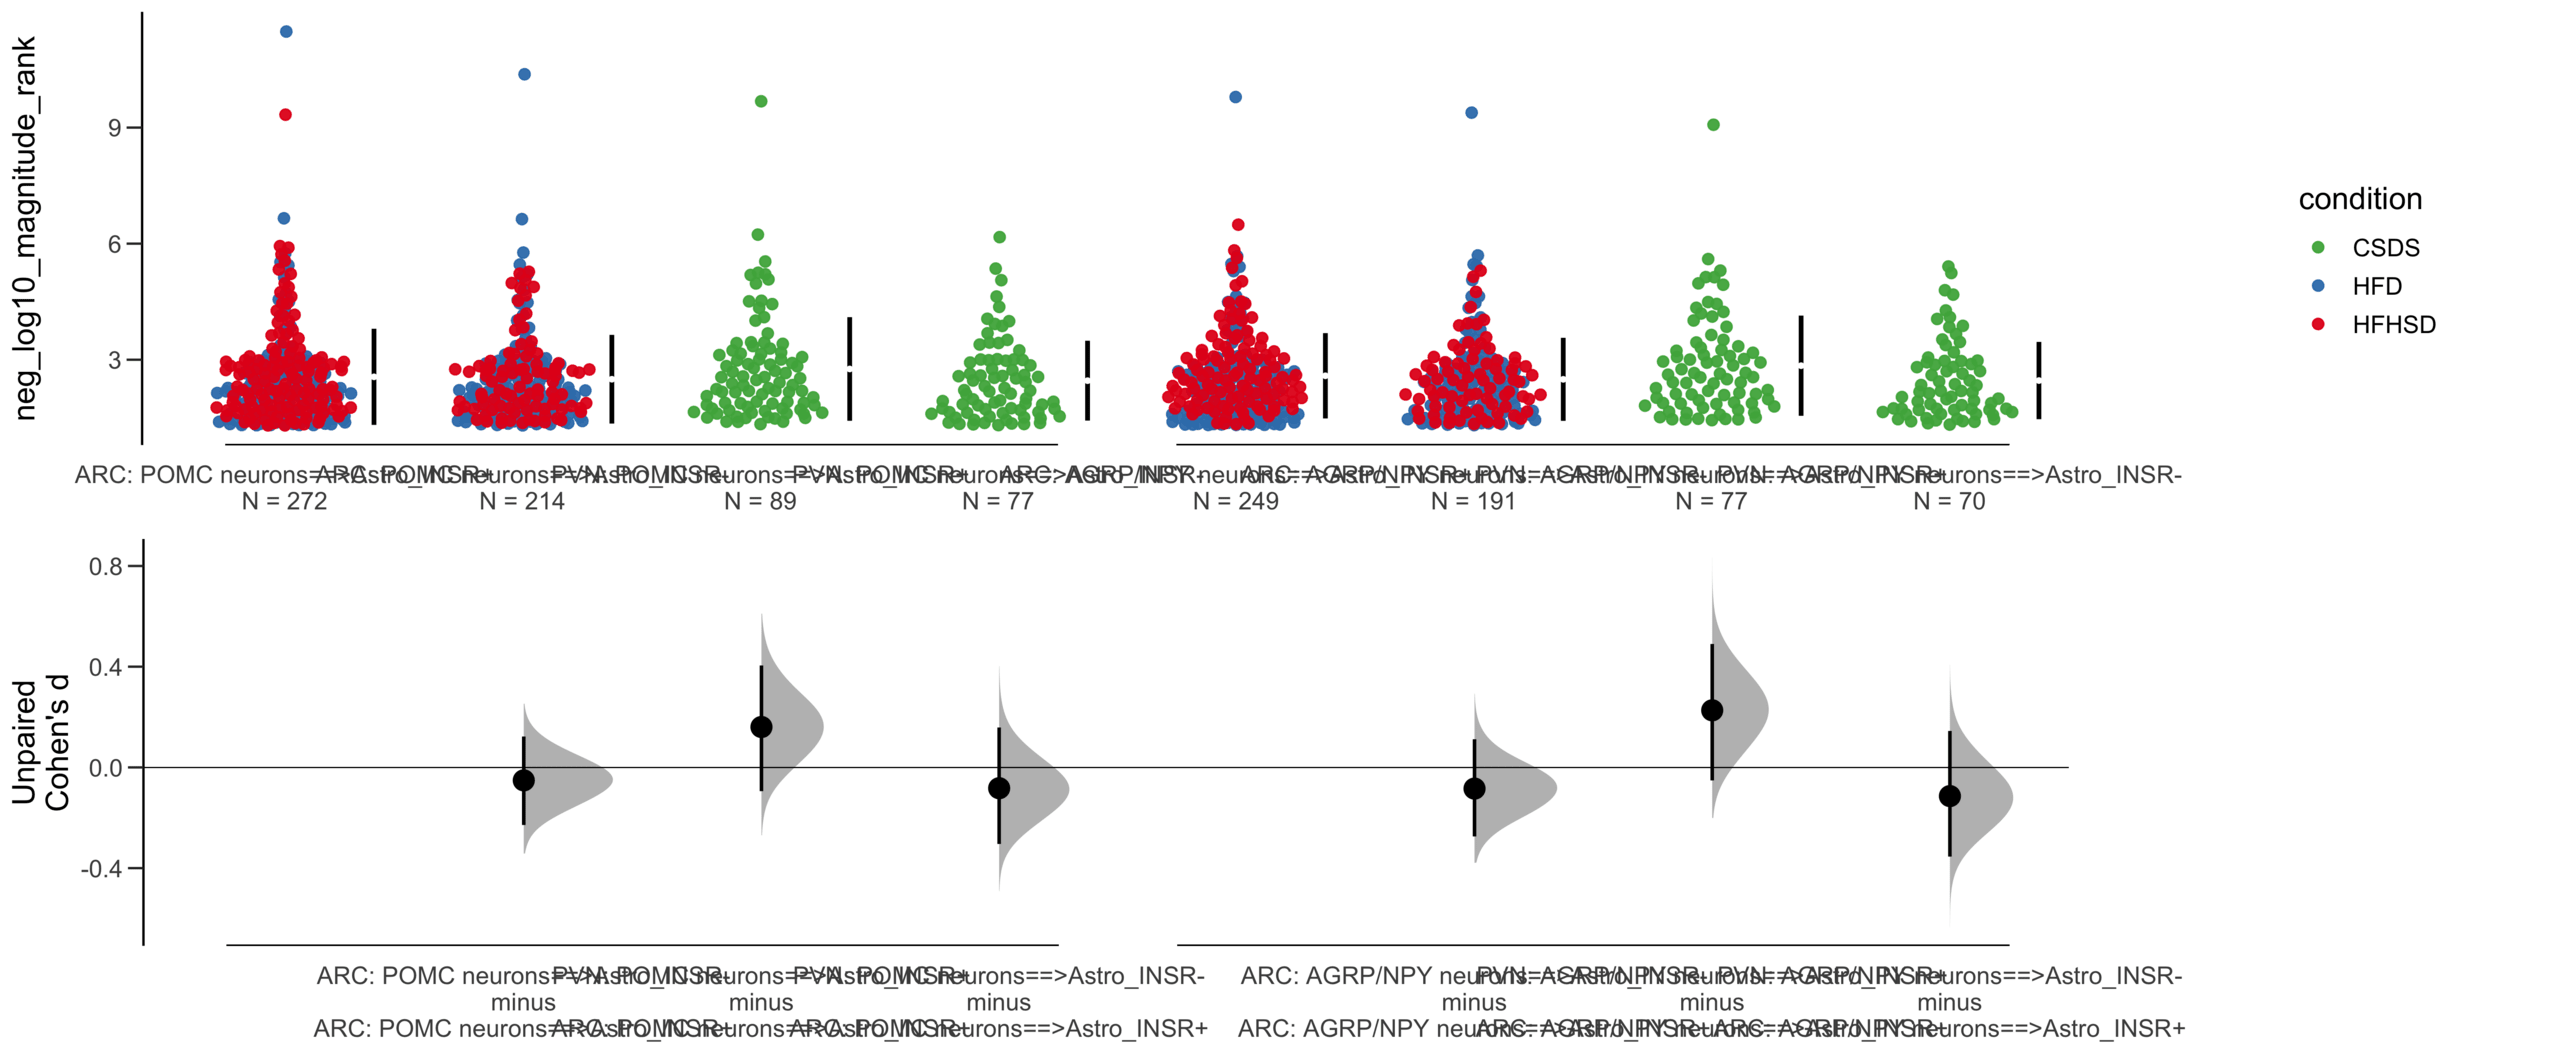
Y Variable : neg_log10_magnitude_rank
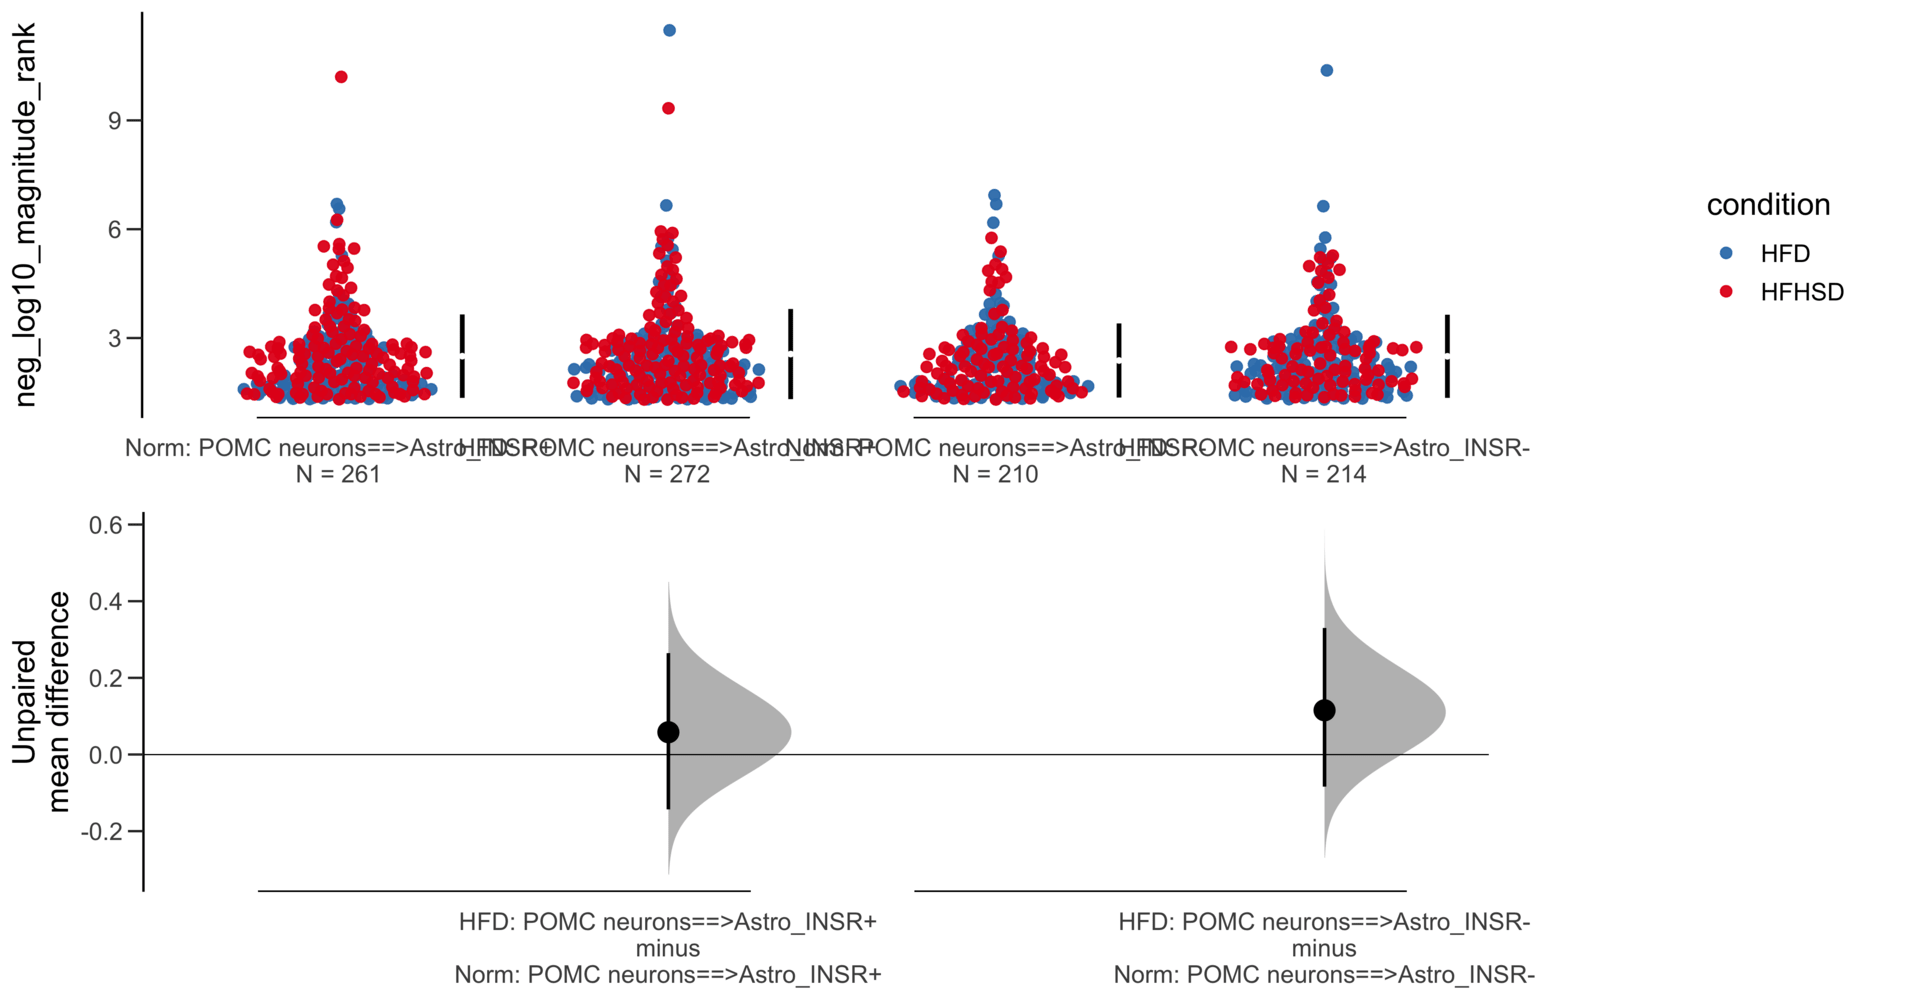
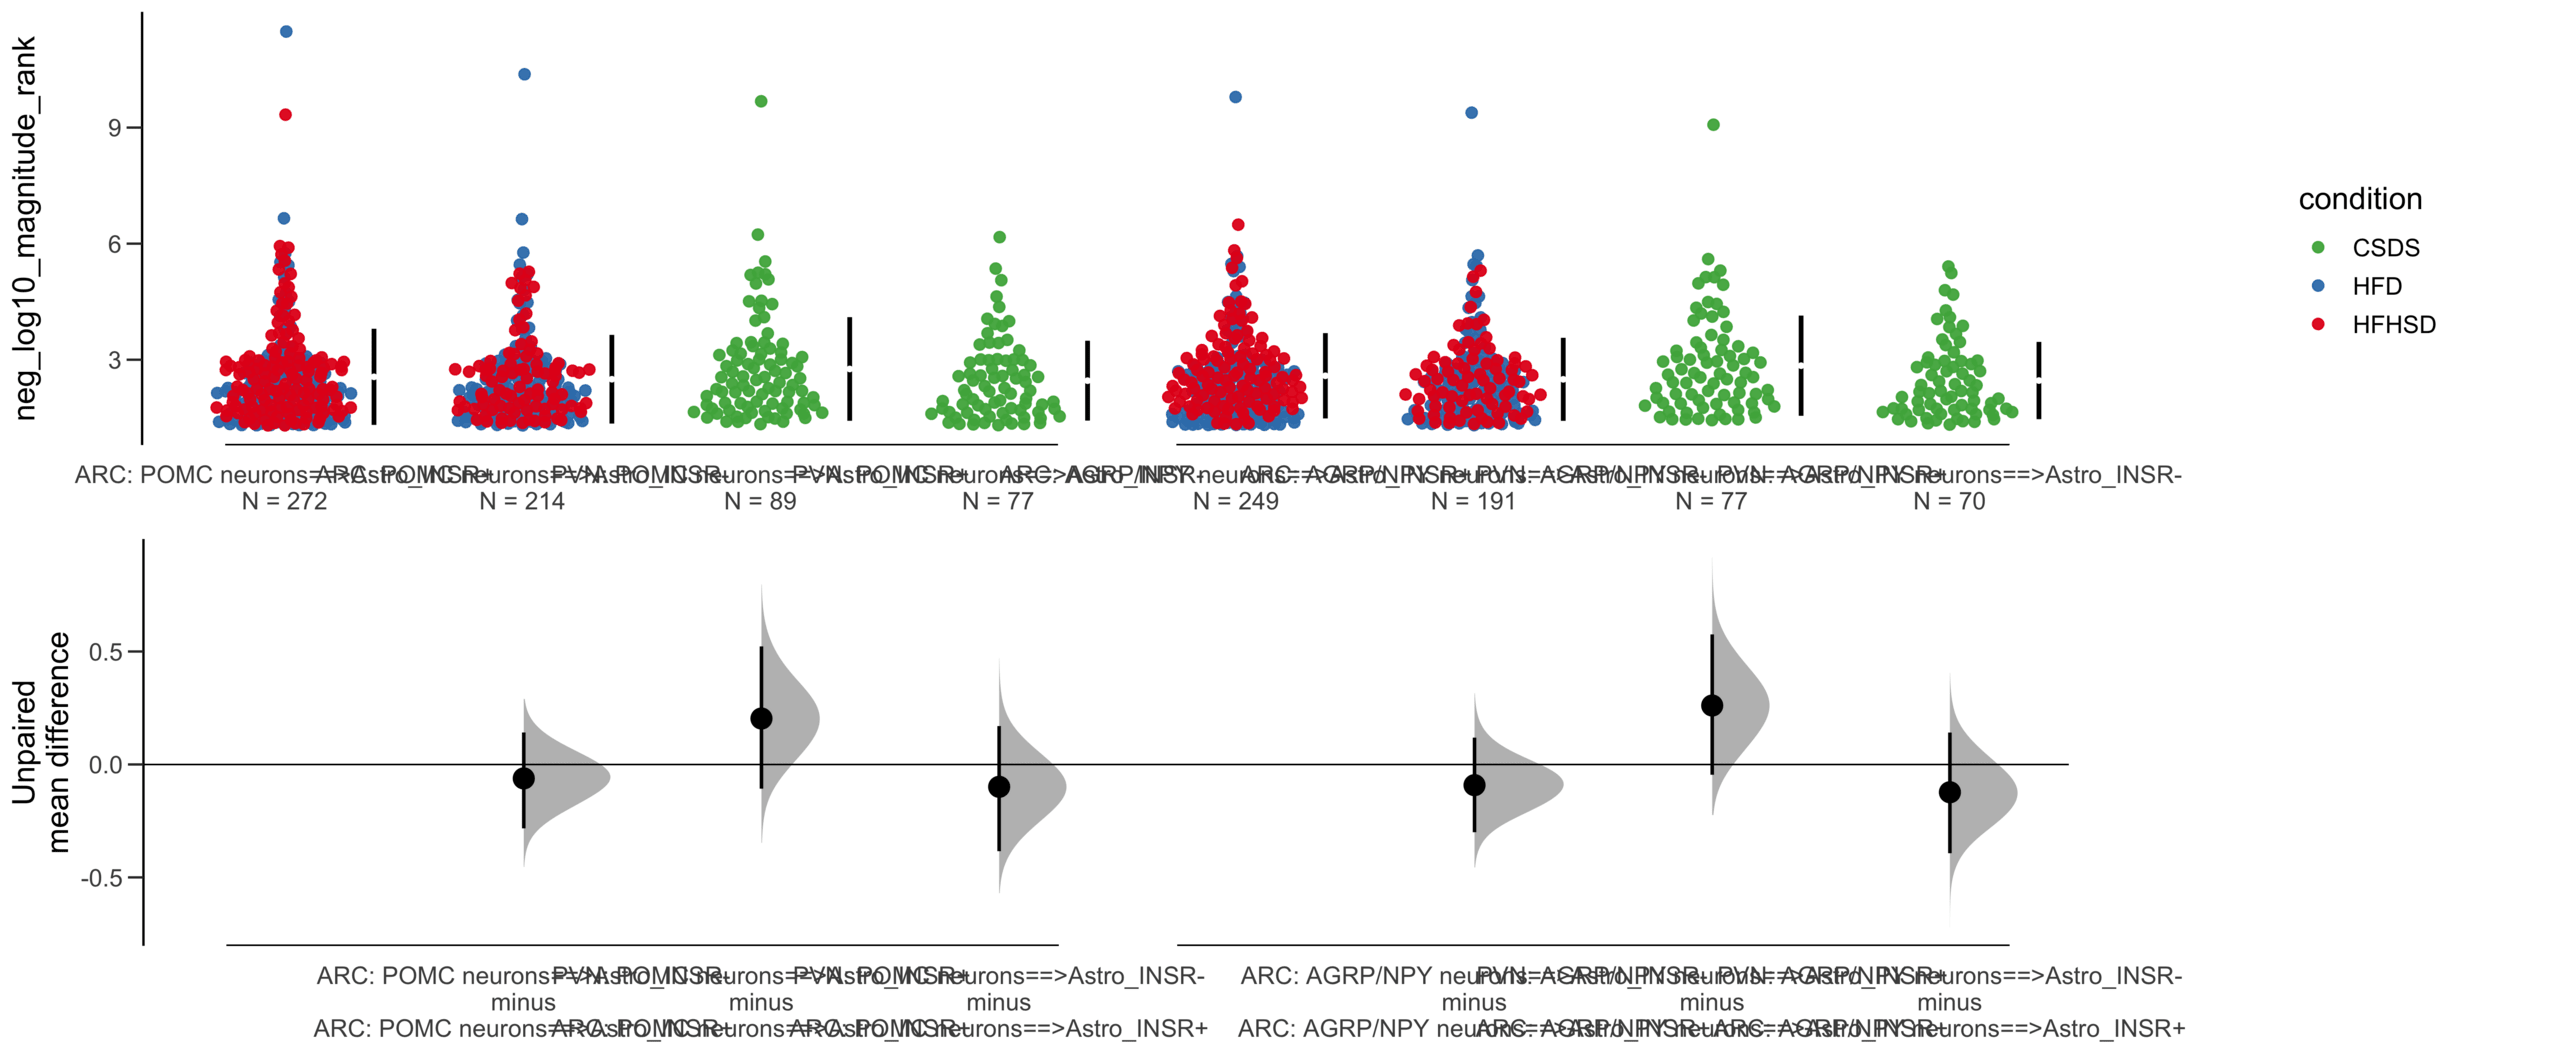
Unpaired mean difference of POMC neurons==>Astro_INSR- (n = 424) minus POMC neurons==>Astro_INSR+ (n = 533)
-0.0905 [95CI -0.24; 0.0532]
5000 bootstrap resamples.
All confidence intervals are bias-corrected and accelerated.
dabestr (Data Analysis with Bootstrap Estimation in R) v0.3.0
=============================================================
Good afternoon!
The current time is 13:42 PM on Saturday July 29, 2023.
Dataset : df.two.group.unpaired
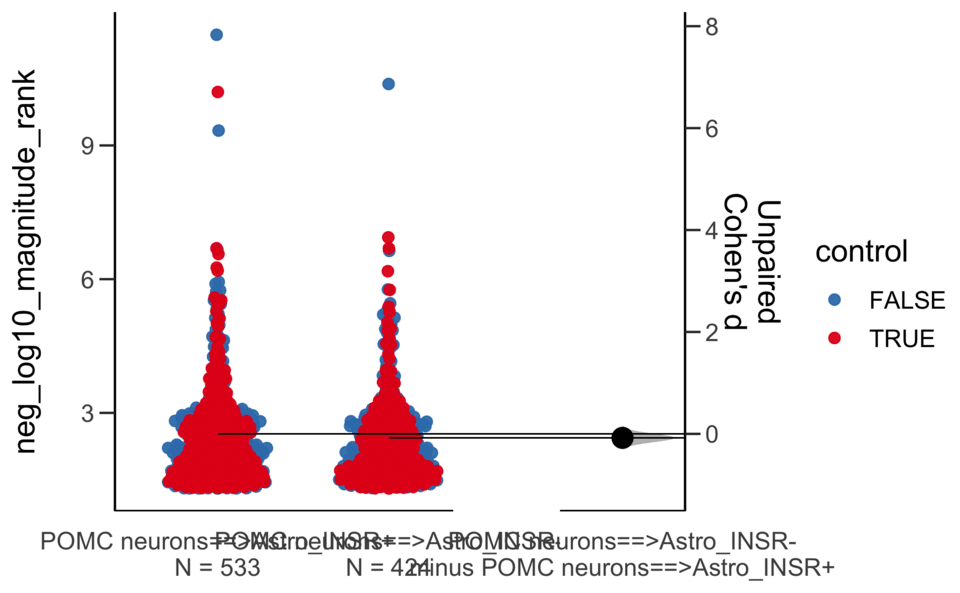
X Variable : pairs
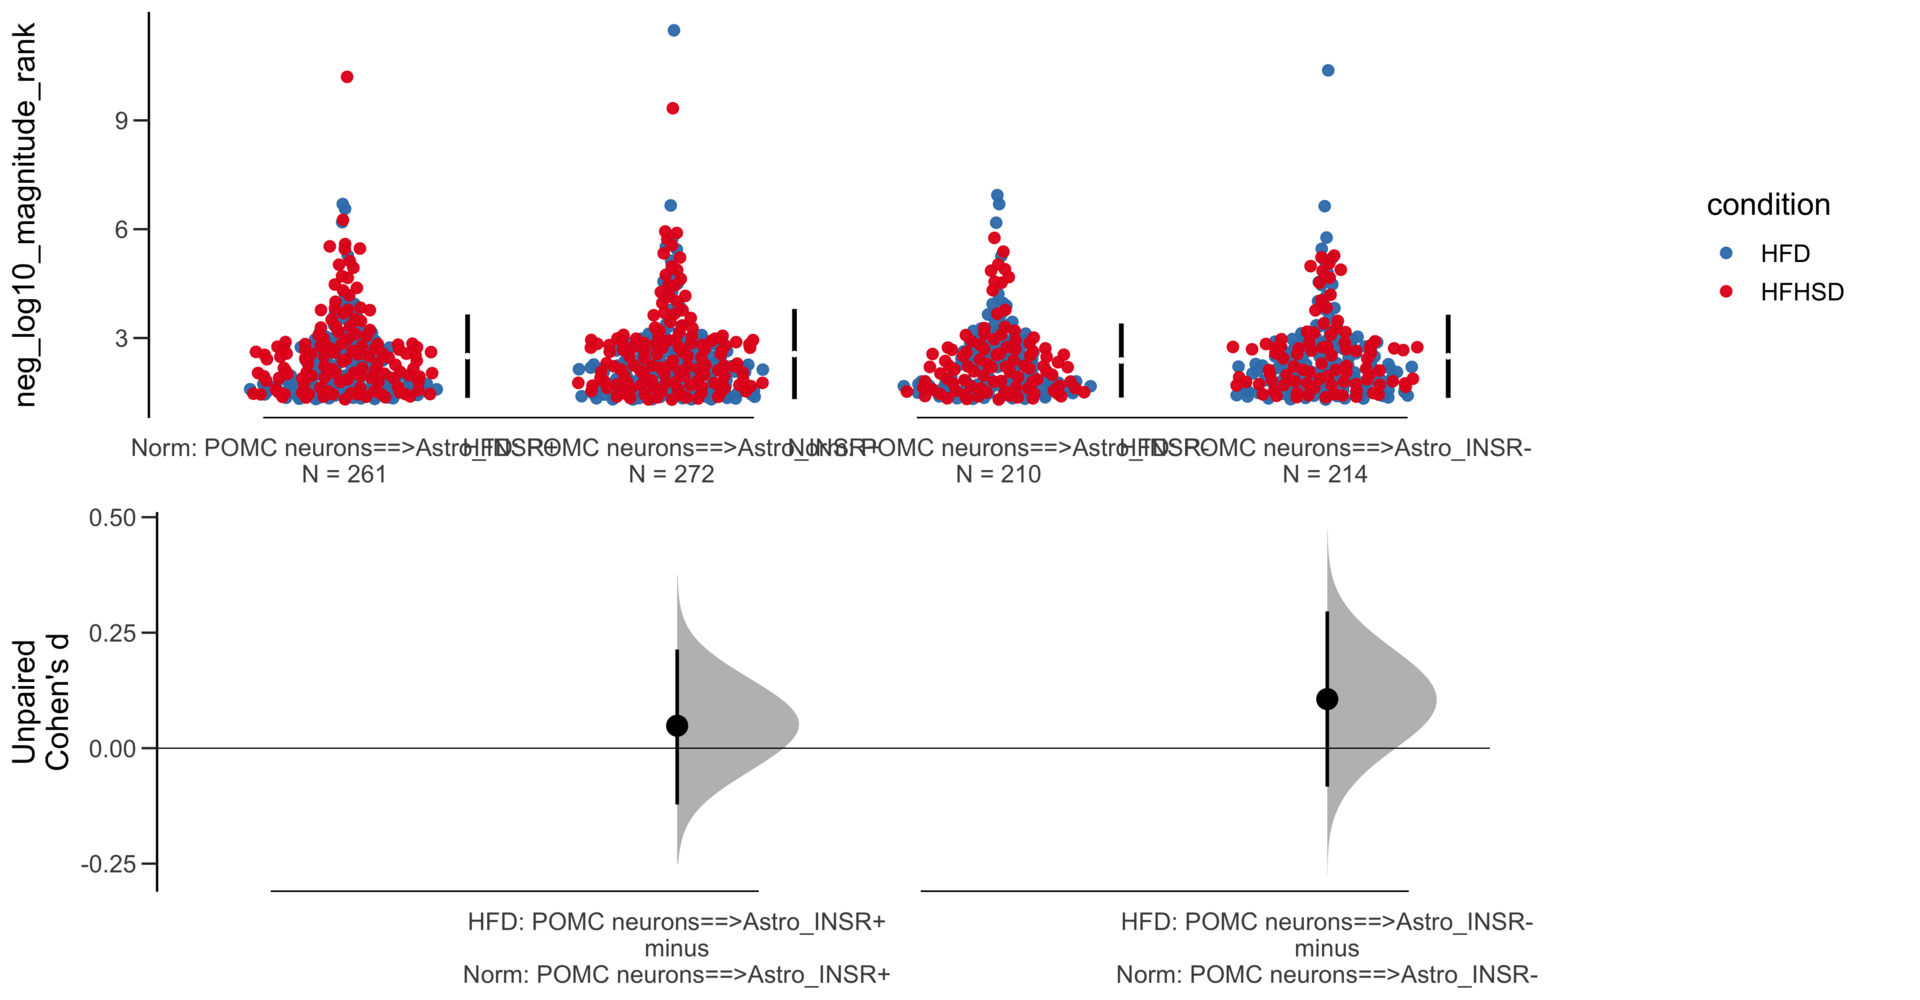
Y Variable : neg_log10_magnitude_rank
Unpaired Cohen's d of POMC neurons==>Astro_INSR- (n = 424) minus POMC neurons==>Astro_INSR+ (n = 533)
-0.0787 [95CI -0.203; 0.048]
5000 bootstrap resamples.
All confidence intervals are bias-corrected and accelerated.
dabestr (Data Analysis with Bootstrap Estimation in R) v0.3.0
=============================================================
Good afternoon!
The current time is 13:42 PM on Saturday July 29, 2023.
Dataset : df.two.group.unpaired
X Variable : pairs
Y Variable : neg_log10_specificity_rank
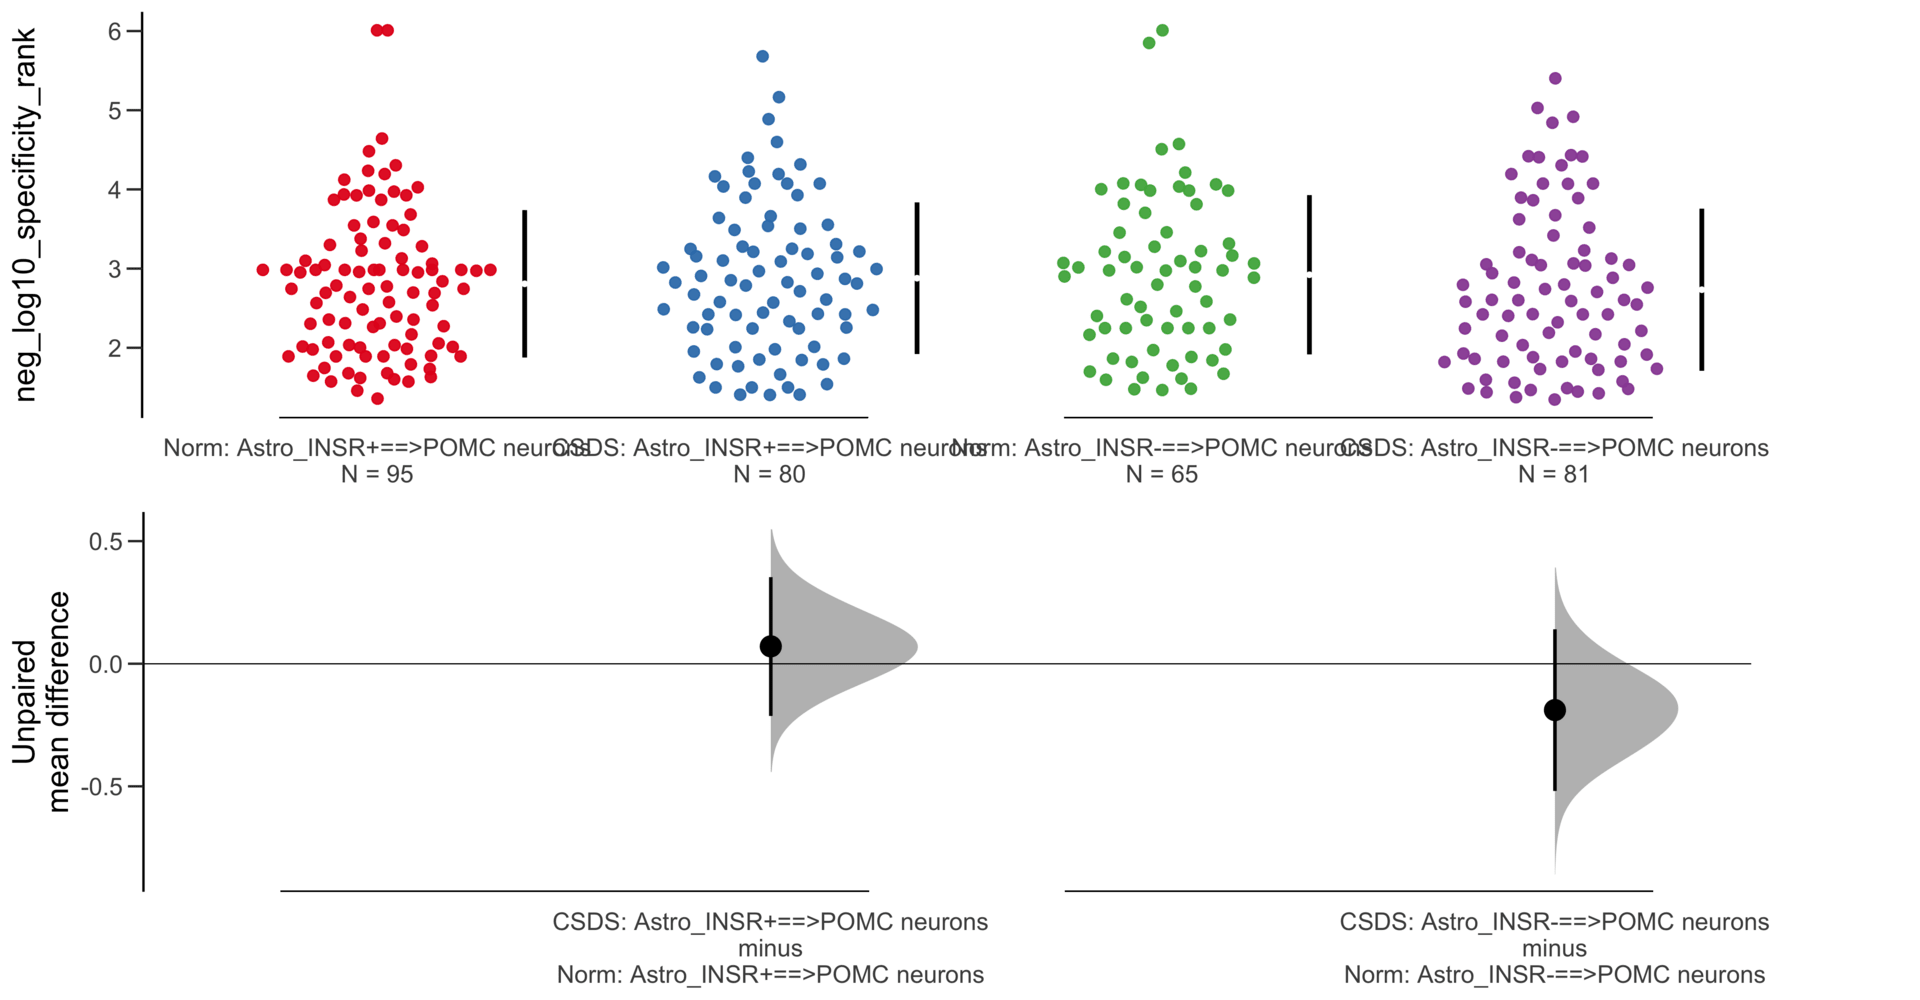
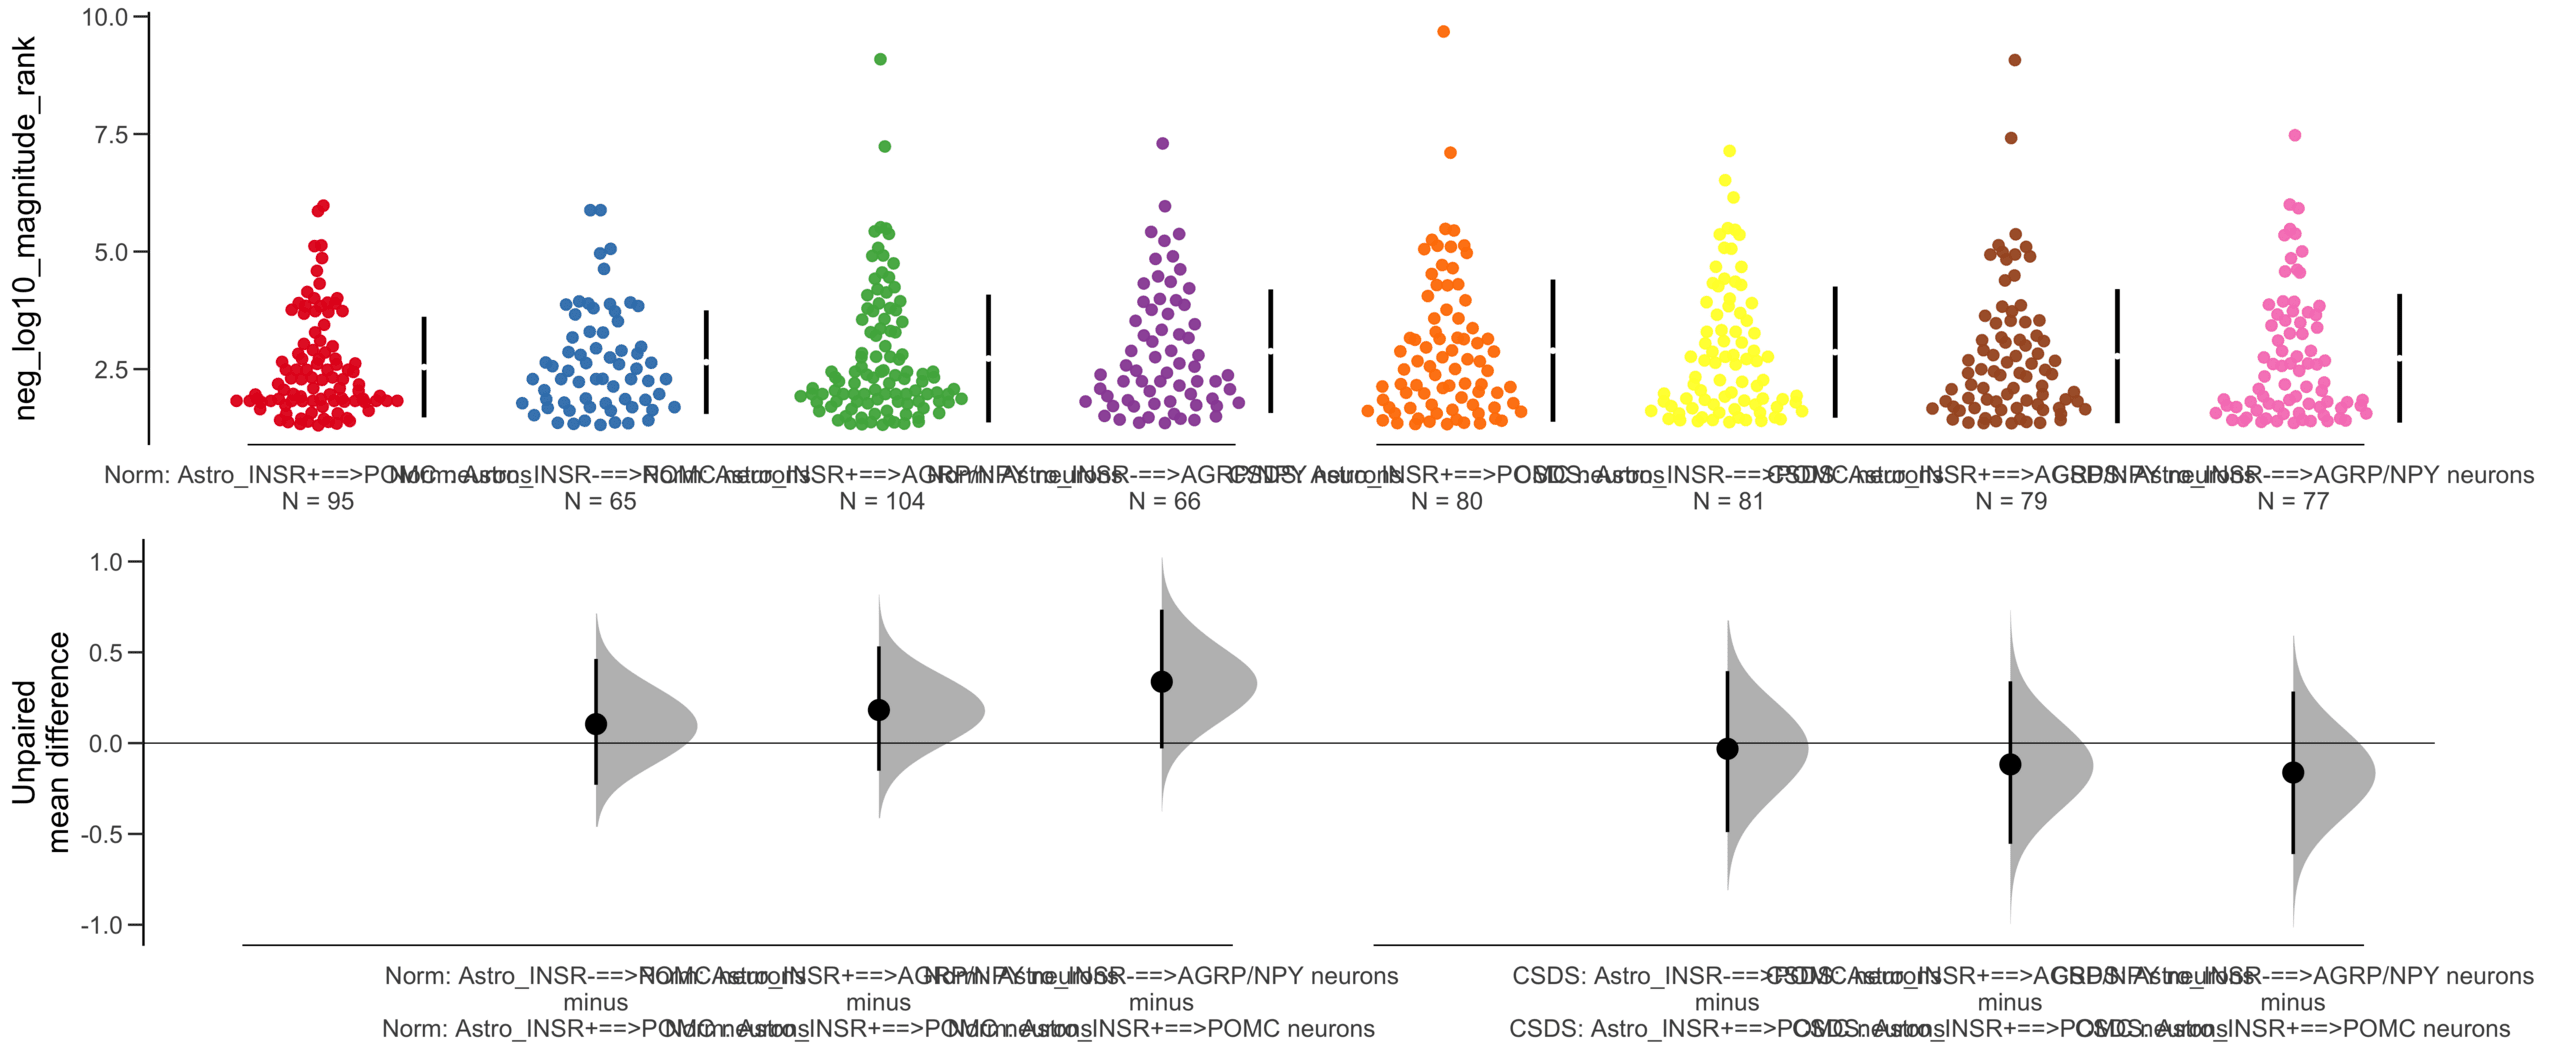
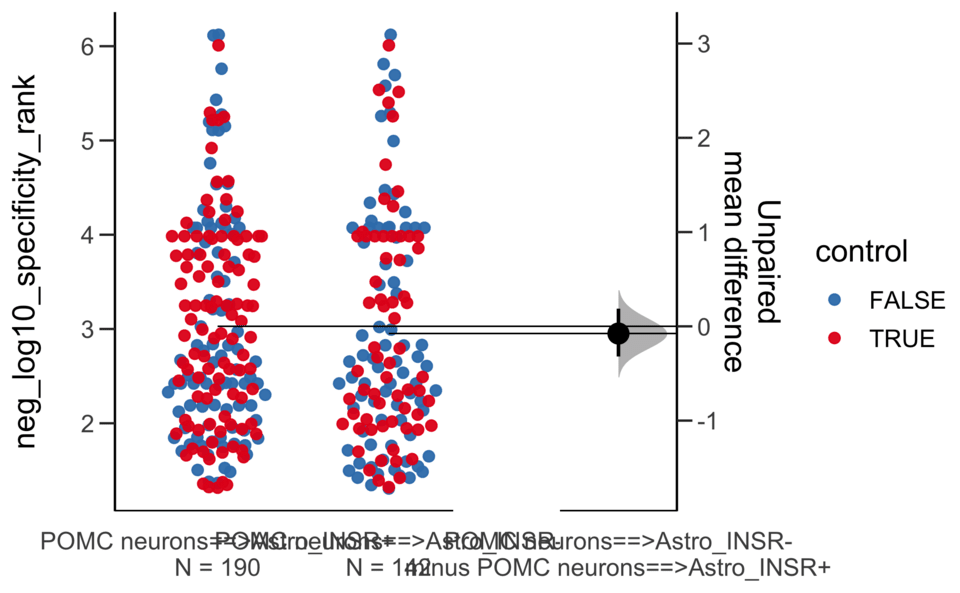
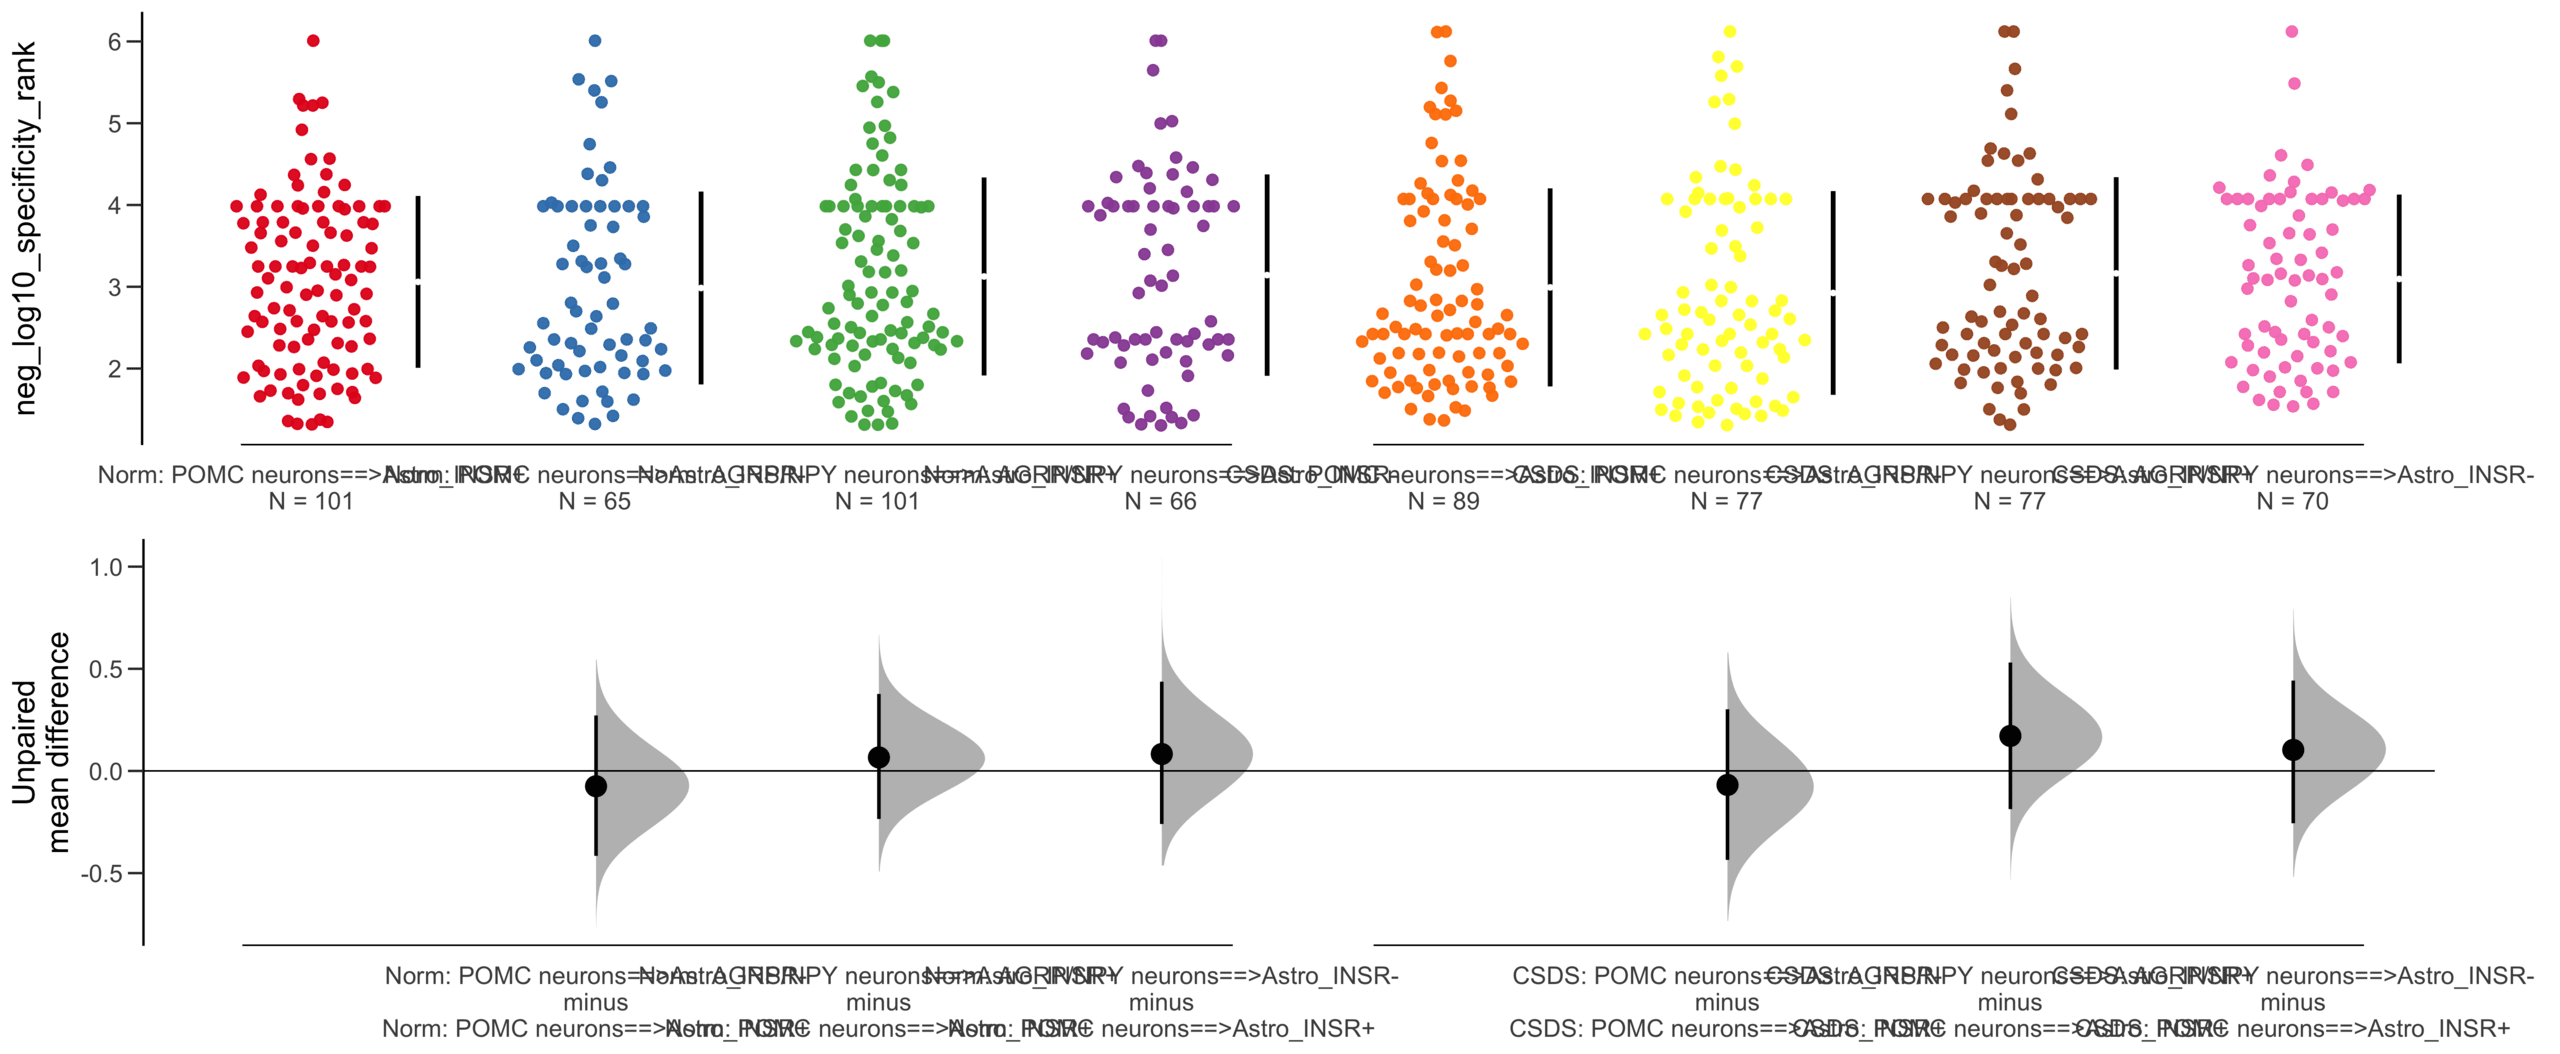
Unpaired mean difference of POMC neurons==>Astro_INSR- (n = 142) minus POMC neurons==>Astro_INSR+ (n = 190)
-0.0763 [95CI -0.32; 0.188]
5000 bootstrap resamples.
All confidence intervals are bias-corrected and accelerated.
dabestr (Data Analysis with Bootstrap Estimation in R) v0.3.0
=============================================================
Good afternoon!
The current time is 13:43 PM on Saturday July 29, 2023.
Dataset : df.two.group.unpaired
X Variable : pairs
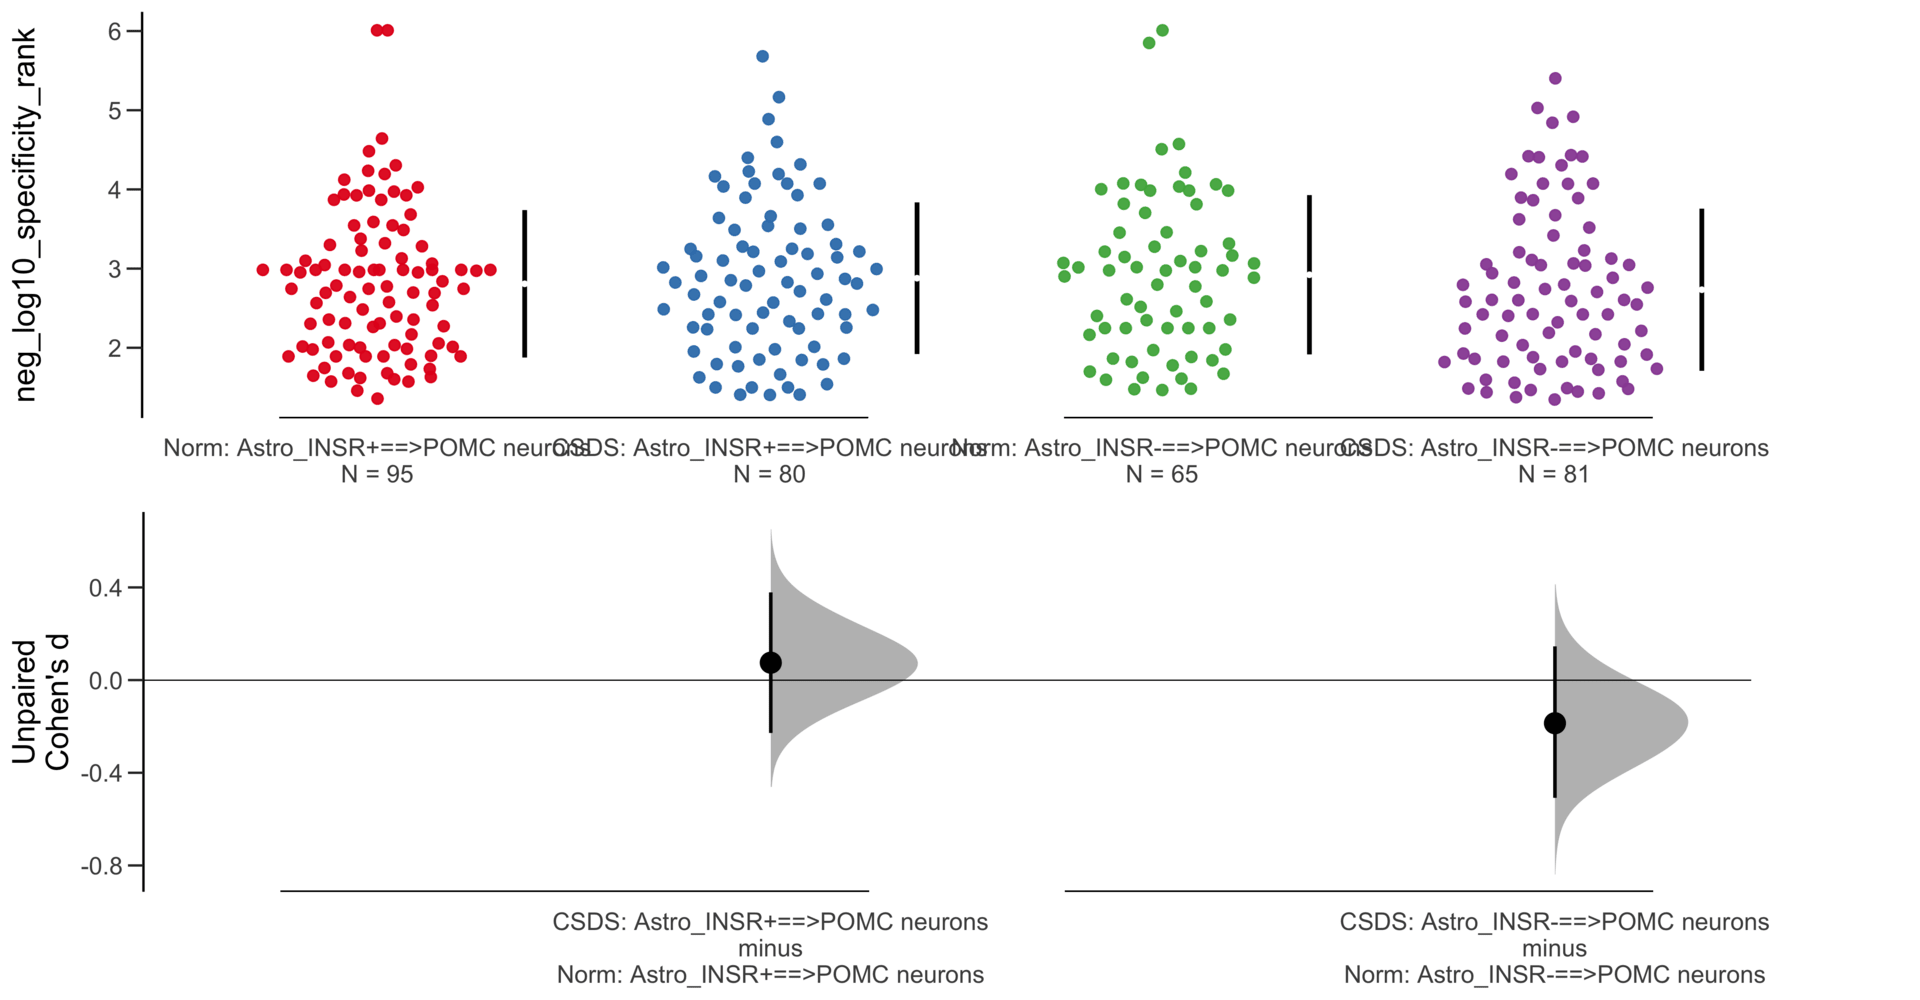
Y Variable : neg_log10_specificity_rank
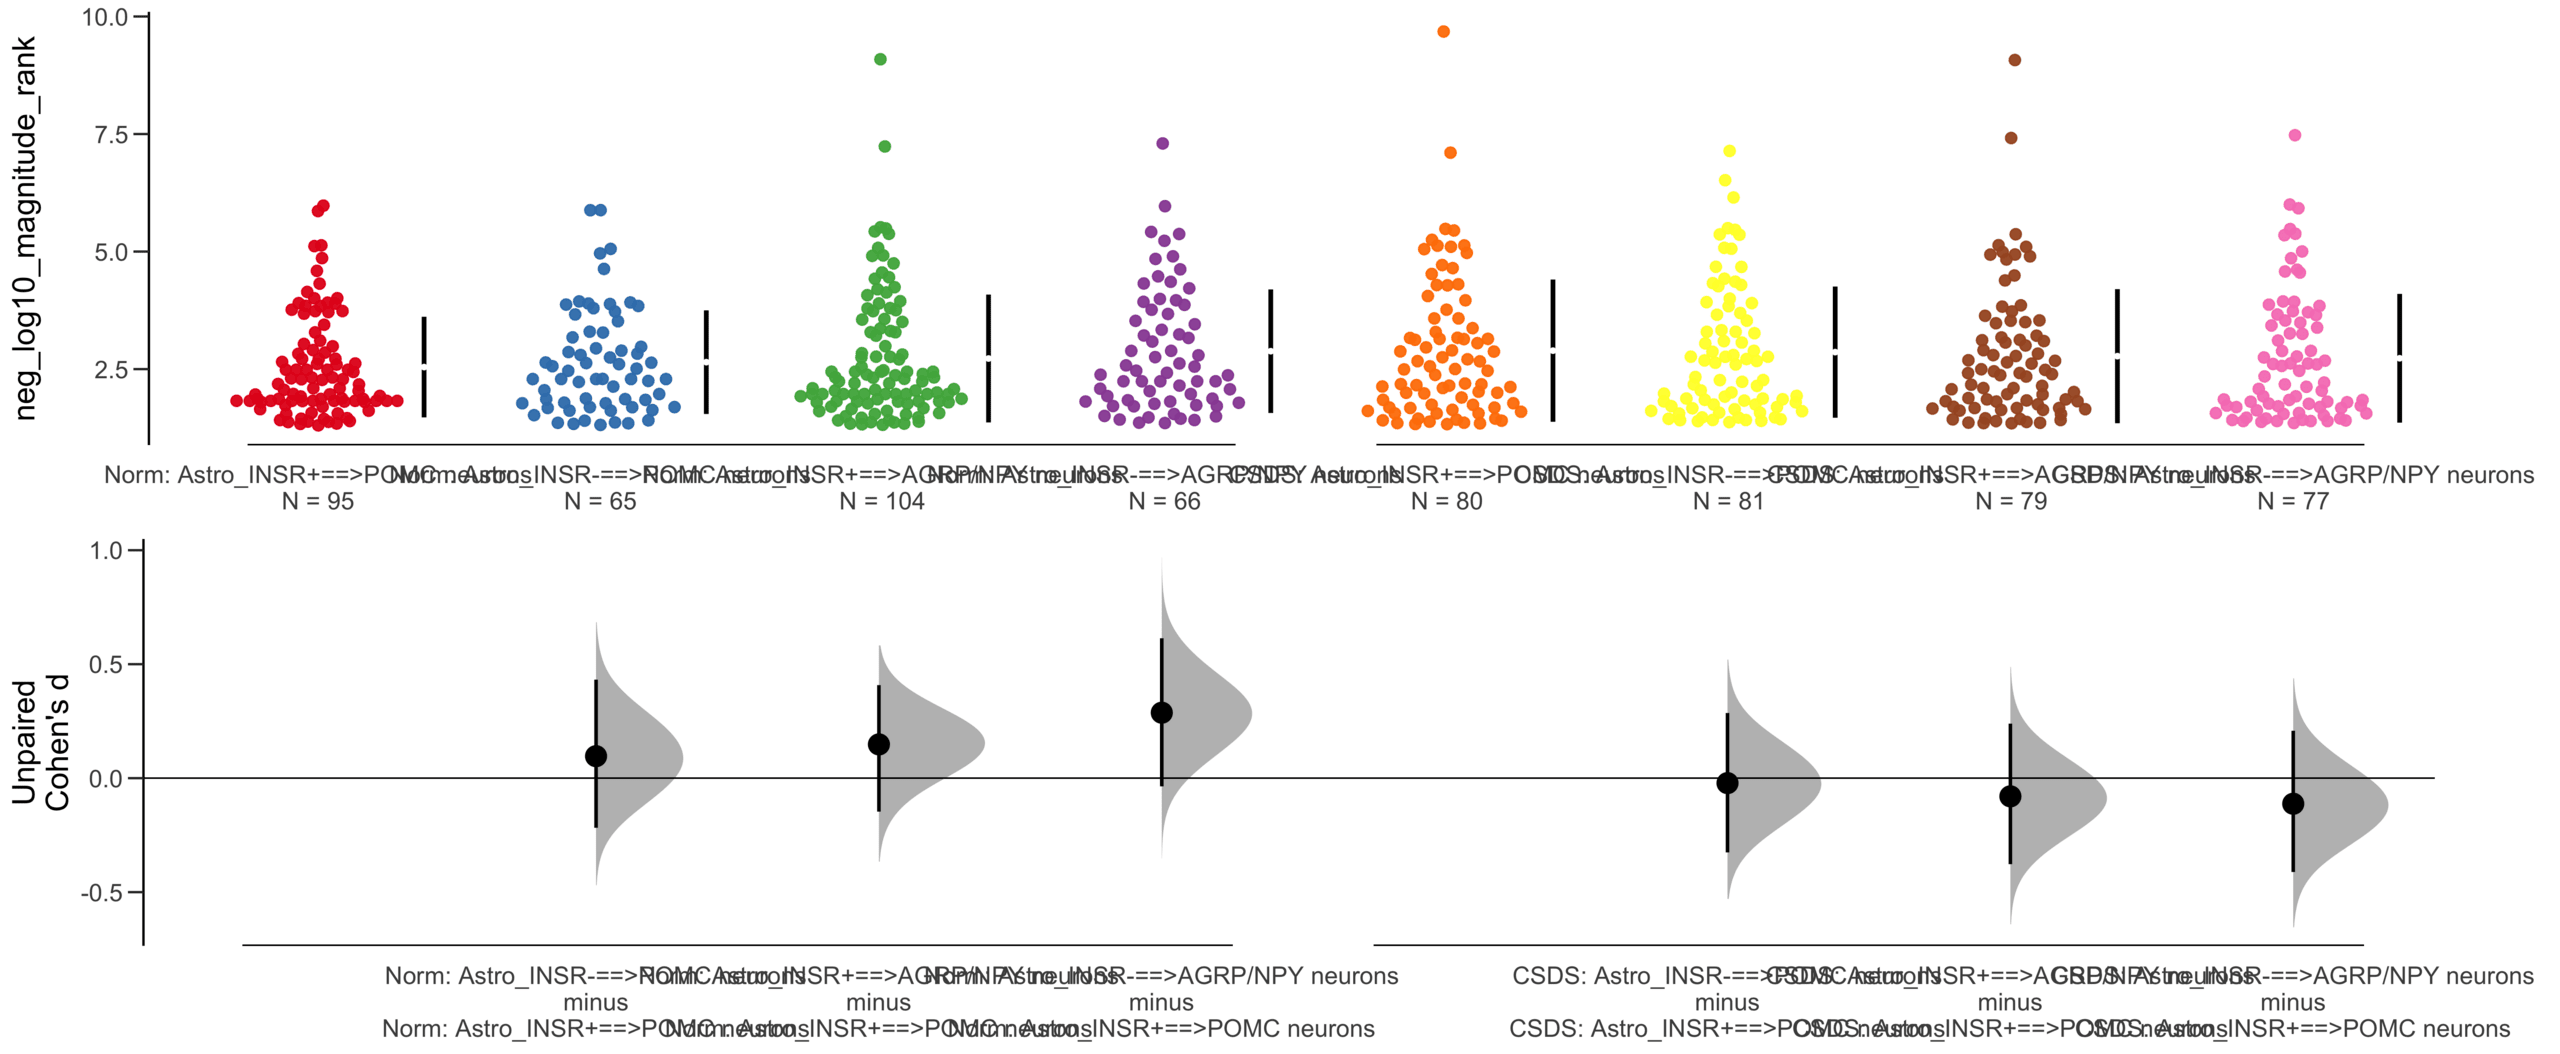
Unpaired Cohen's d of POMC neurons==>Astro_INSR- (n = 142) minus POMC neurons==>Astro_INSR+ (n = 190)
-0.0656 [95CI -0.278; 0.162]
5000 bootstrap resamples.
All confidence intervals are bias-corrected and accelerated.
dabestr (Data Analysis with Bootstrap Estimation in R) v0.3.0
=============================================================
Good afternoon!
The current time is 13:43 PM on Saturday July 29, 2023.
Dataset : df.two.group.unpaired
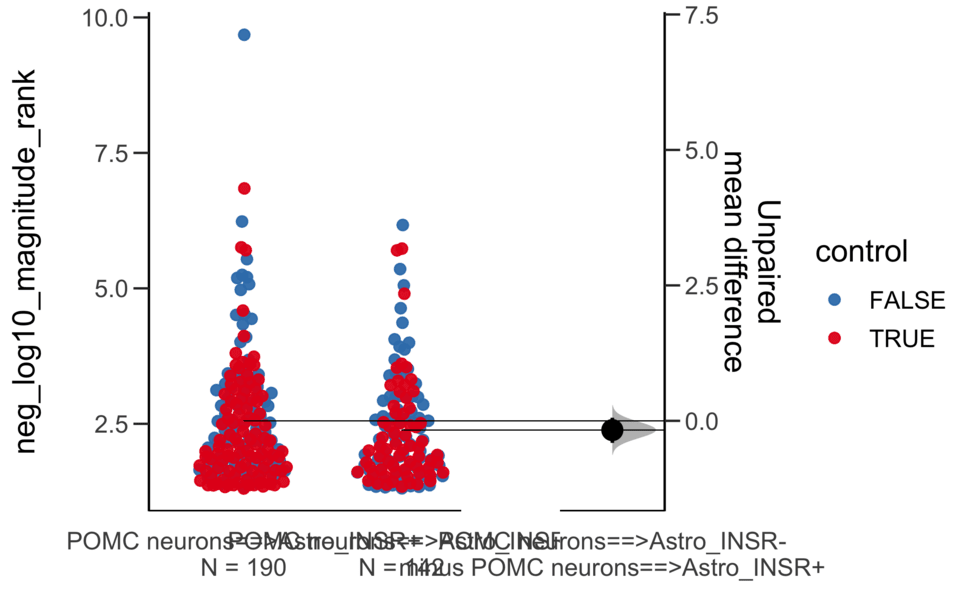
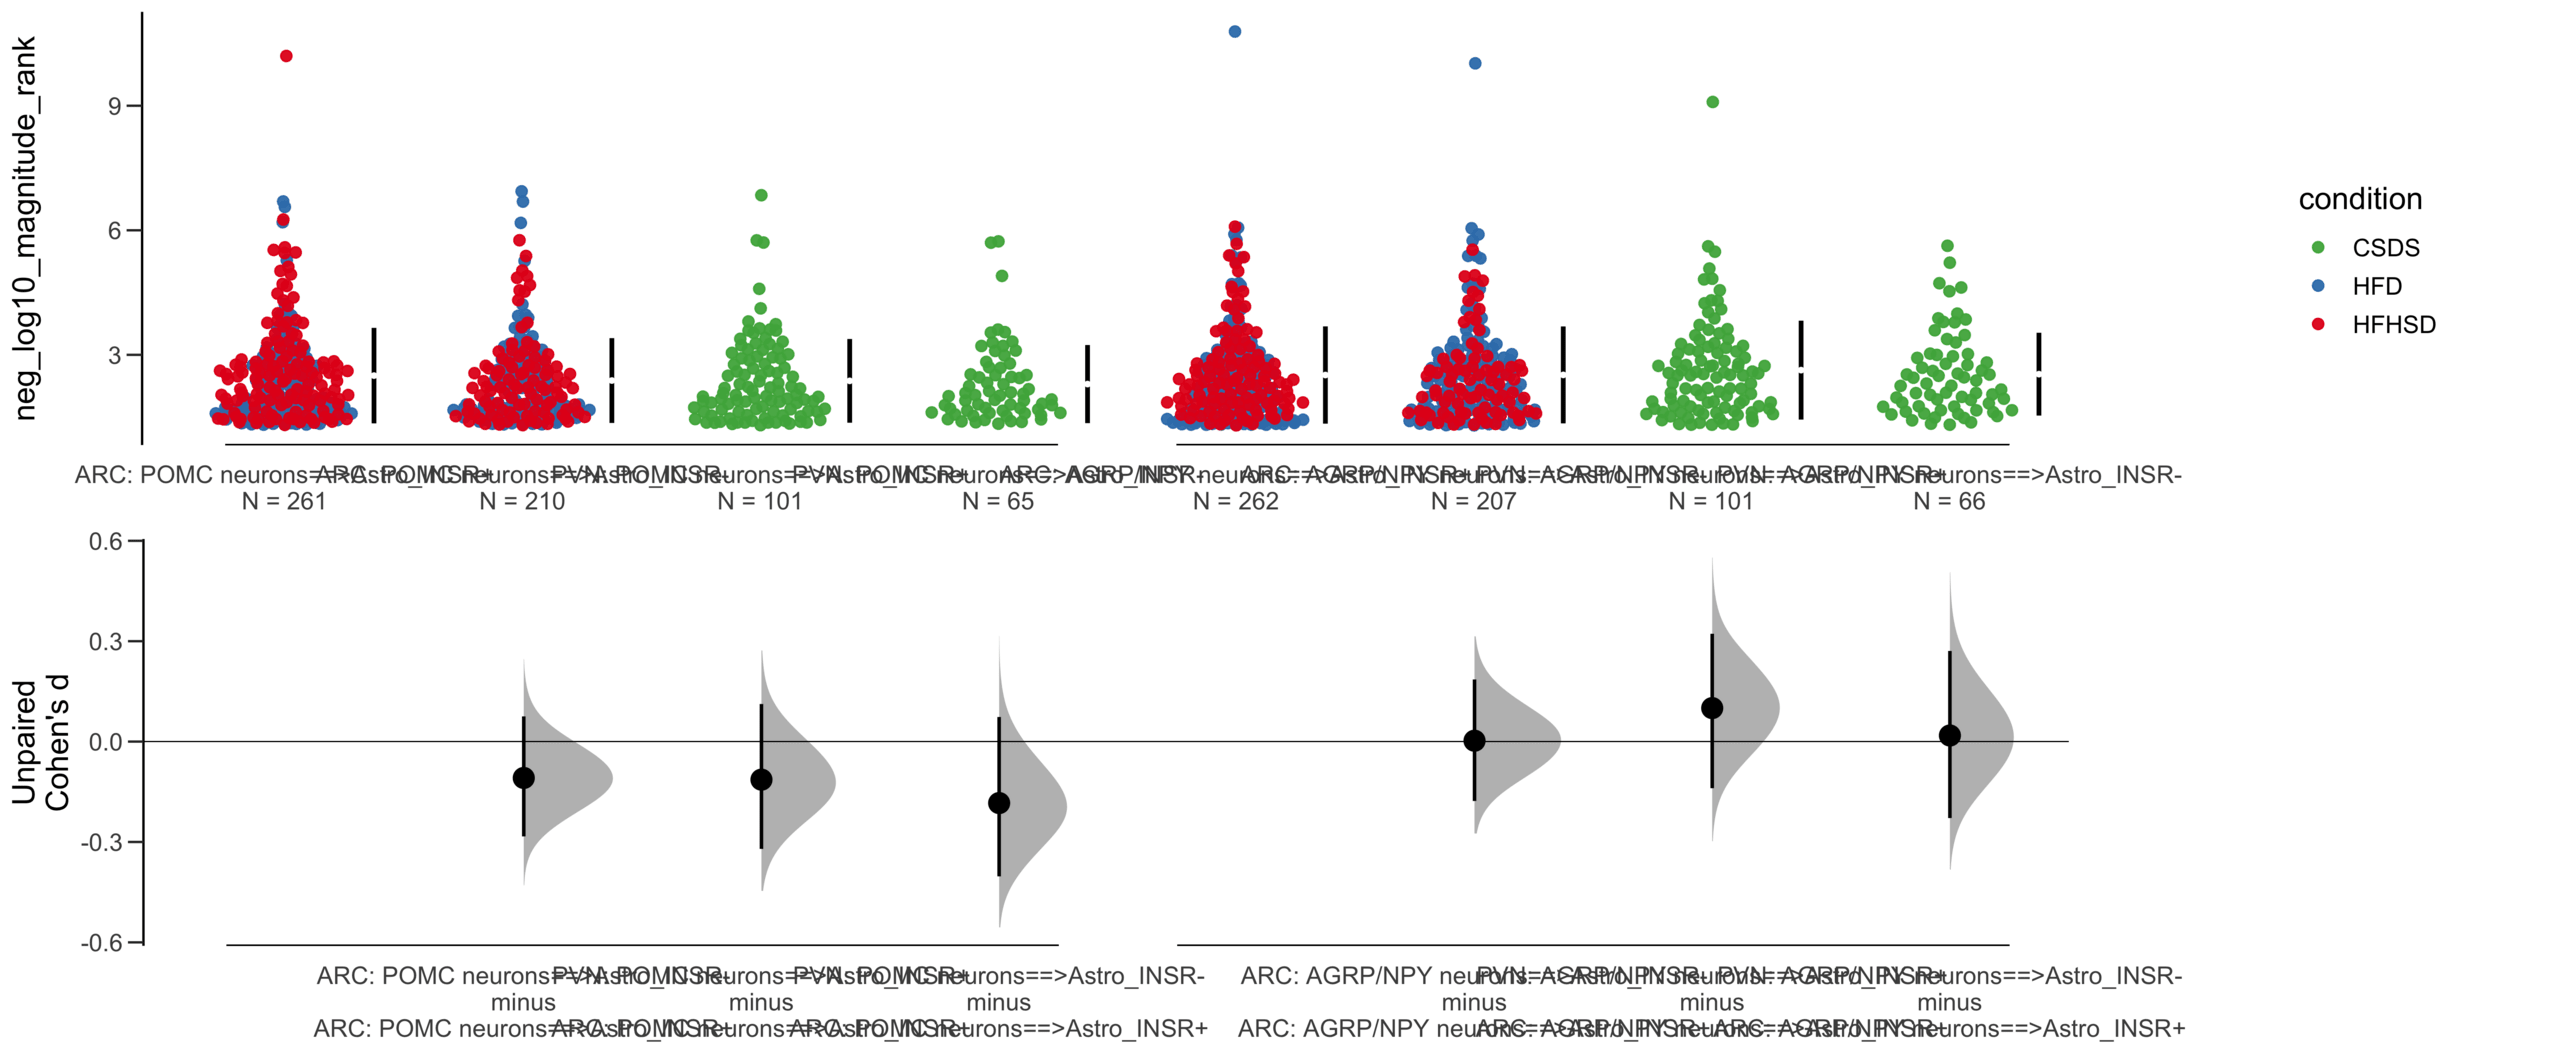
X Variable : pairs
Y Variable : neg_log10_magnitude_rank
Unpaired mean difference of POMC neurons==>Astro_INSR- (n = 142) minus POMC neurons==>Astro_INSR+ (n = 190)
-0.171 [95CI -0.406; 0.0574]
5000 bootstrap resamples.
All confidence intervals are bias-corrected and accelerated.
dabestr (Data Analysis with Bootstrap Estimation in R) v0.3.0
=============================================================
Good afternoon!
The current time is 13:43 PM on Saturday July 29, 2023.
Dataset : df.two.group.unpaired
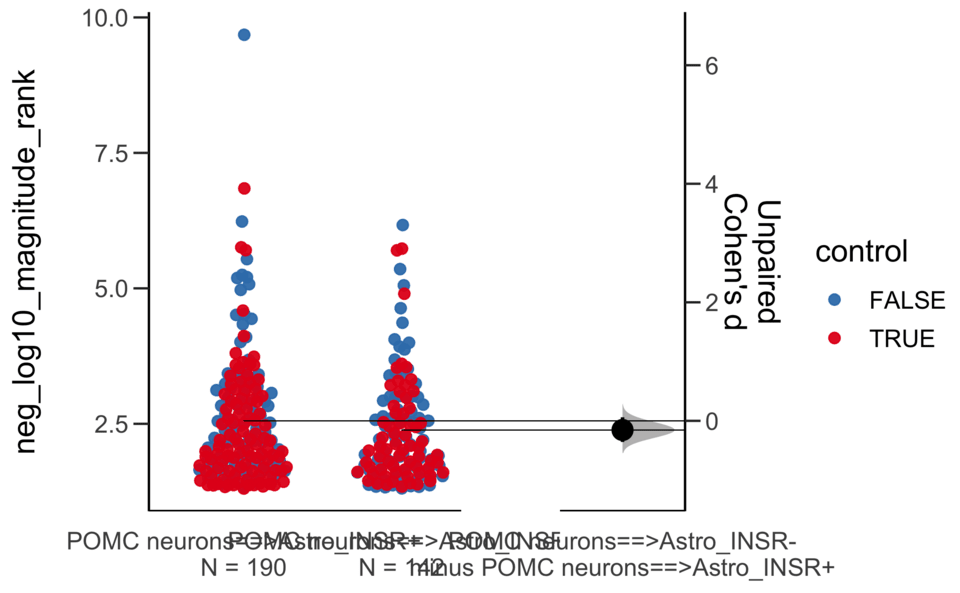
X Variable : pairs
Y Variable : neg_log10_magnitude_rank
Unpaired Cohen's d of POMC neurons==>Astro_INSR- (n = 142) minus POMC neurons==>Astro_INSR+ (n = 190)
-0.154 [95CI -0.356; 0.0602]
5000 bootstrap resamples.
All confidence intervals are bias-corrected and accelerated.